Appendix B – Characterization – Additional Material
Appendix B describes the natural gas and petroleum system activities, equipment, and emissions sources along the supply chain shown in Figure 2. Each segment is described and reported emissions are summarized.
B.1 Field Production
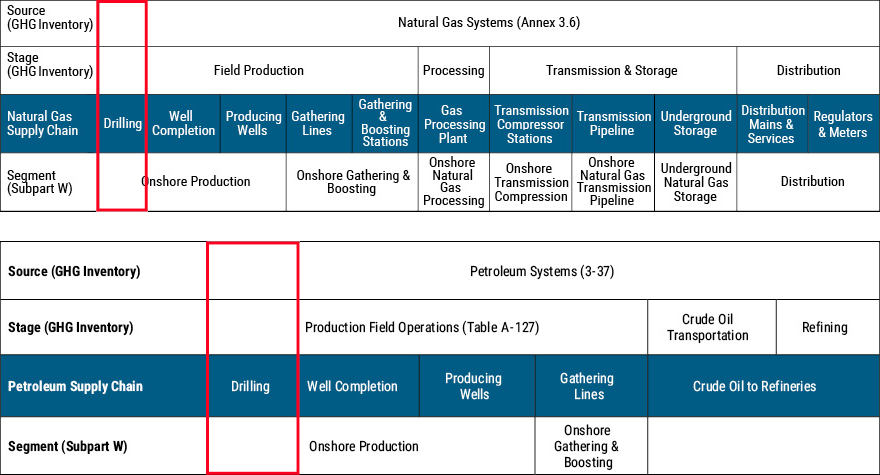
B.1.1 Drilling
 Figure 48. Drilling.
Source: Adapted from the American Gas Association and EPA Natural Gas STAR Program
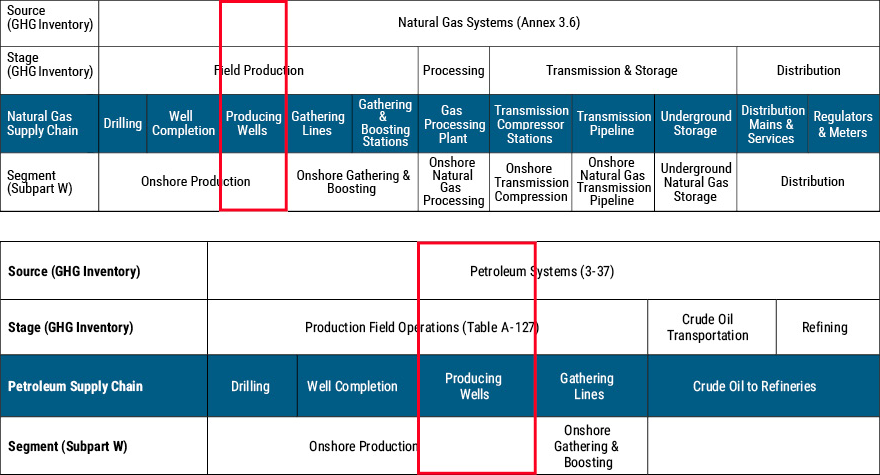
Table 7. Natural gas and petroleum system supply chain nomenclature in different programs – drilling
Source: Inventory of U.S. Greenhouse Gas Emissions and Sinks: 1990-2015 (USEPA 2017a).
B.1.1.1 Drilling Stage
Table 8. 2015 Fugitive methane emissions from oil field operations – well drilling
Source: Adapted from USEPA ANNEX 3.5, Methodology for Estimating CH4 and CO2 Emissions from Petroleum Systems (USEPA 2017a).
| Segment/Source | Activity Data– Table 3.5-5: Activity Data for Petroleum System Sources, for2015 | Average CH4 Emission Factors– Table 3.5-3: Average CH4 Emission Factors (kg/unit activity) for Petroleum Systems and Sources | CH4 Emissions (kt/yr)– Table 3.5-2: CH4 Emissions (kt) for Petroleum Systems, by Segment and Source, for 2015 |
| Well Drilling | 17,774 No. of oil wells drilled | 0 kg/well | 0 |
When drilling, wellheads are designed with a sealing element around the drill pipe to prevent the escape of drilling mud, potentially entrained gas present in the mud, and drill cuttings brought to the surface. Wireline wellheads are sealed as well to prevent the escape of brine or other fluid under pressure, and potentially gas that migrates into such fluids from the formation. In general, onshore operators in the United States practice overbalanced drilling. This technique uses mud or other fluid pressures above that of the formation pressures to keep formation fluids and gases (where present) from migrating into the wellbore and coming to the surface. There are instances where gas or fluids do escape into the wellbore (referred to as a “kick”) that are metered carefully through a mud/gas separator prior to the mud being recirculated back into the well for continued operations. A “kick” is an atypical event and can result in a much more serious well control incident if not properly managed. The gas released from the mud/gas separator is typically either vented to the atmosphere or flared. Such events vary in the volume of methane emitted to the atmosphere, and in general have been considered more of a safety concern than an environmental issue.
B.1.1.2 Drill Rig
One aspect of the oil production cycle where emissions are not entirely captured are emissions from the drilling and completions phases of well development. New oil drilling rigs are designed to be mobile and are routinely transported from location to location depending on the availability of work. A rig may stay in one location only long enough to drill a single well or may be contracted to drill multiple wells on a single location. Depending on the depth of the target formation, it can take less than 10 days to drill a single horizontal well with a 10,000 foot lateral. A lateral is the portion of the downhole well that extends horizontally out from the vertical well shaft.
Drilling wells require electrical power. Modern horizontal drilling rigs are electrically driven, and routinely operate in areas where electricity for purchase (pole power) is unavailable. As a result, they are equipped with generator sets to provide the power necessary to operate the drilling rig and associated equipment. In addition, many states require air drilling (also known as pneumatic percussion drilling) or fresh water drilling, up until the well penetrates, and is cased through, the deepest potable freshwater reservoir. For those areas requiring air drilling, additional air compressors are required to supply sufficient volumes of high-pressure air to perform this technique. This point, referred to as the surface casing point, is the largest diameter bore and is cased (tubular metal casing is inserted into the wellbore) and cemented (using specialty-grade cements) in order to minimize the potential impacts to potable aquifers.
The primary fuel for drilling rigs, including the compressors needed for air drilling and pumps to circulate drilling fluids, is diesel fuel. Combustion of diesel fuel does not result in significant emissions of methane. In areas where natural gas is available in sufficient quantities, some operators have mandated that their drilling contractor either co-fire natural gas along with diesel fuel or utilize generators capable of running solely on natural gas as fuel. Pollutant and greenhouse gas (GHG) emissions from the combustion of natural gas in such generator sets are lower than when firing diesel fuel alone. In addition, limiting the amount of diesel fuel consumed has the downstream impact of requiring fewer fuel trucks to supply the rig and minimizing the risks inherent to driving. Firing natural gas may also present unique challenges for operators. Given the mobile nature of oil drilling rigs, all lines and connections are necessarily temporary in nature. As a result, it is possible to encounter methane leakage from these supply lines and associated equipment.
B.1.1.3 Generators
Methane emission from electrical generator operation is unlikely, since such engines combust primarily diesel fuel. In instances where dual-fueling or natural gas firing is performed, methane emissions may result from temporary piping connections, regulators, valves, and flanges and from incomplete fuel combustion.
B.1.1.4 Mud Tanks
Drilling mud is either water- or oil-based with additives employed to increase fluid density. In modern oil-based mud, the base is similar to mineral oil. Virgin base oil and drilling mud is stored in tanks prior to use. When in use, the mud is pumped into the drill string which provides fluid cooling to the drilling bit and rotational motion via a “mud motor” to turn the bit. The drilling mud also carries drill cuttings to the surface. Once at the surface, the mud and cuttings are separated as much as possible. The cleaned mud is recirculated back into the mud tanks for reuse, while the cuttings and residual mud are sent off-site for disposal.
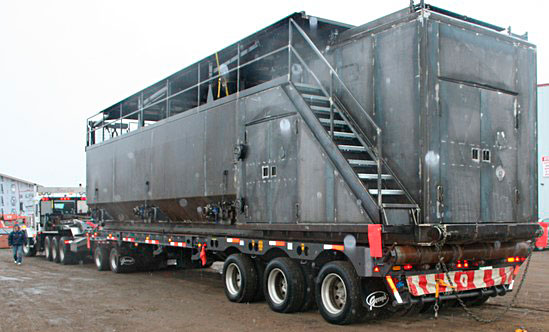
Figure 49. Mud tanks.
Source: Provided by USEPA
Methane emissions from mud tanks that can occur during a “kick” are expected since the mud carries the cuttings (and hydrocarbons held in those cuttings) to the surface. As the cuttings reach the surface, off-gassing of methane (and other air pollutants) would occur if there were to be a “kick”. Methane emissions from this process do not appear to be well characterized. One study developed an emission factor for such emissions based on a similar study performed for offshore drilling operations (ERG 2007).
Most operators require continuous monitoring for hydrogen sulfide (H2S) and gaseous hydrocarbons around the mud tanks, focusing on where the cuttings are initially removed on the shakers. These areas are enclosed during winter operations since they are at times manned and sampled, and there are anecdotal reports of flash fires in these areas like that reported in West Greely, CO on May 8, 2017.
B.1.1.5 Wellhead
Table 9. 2015 Fugitive methane emissions from oil field operations – wellhead.
Source: Adapted from USEPA ANNEX 3.5, Methodology for Estimating CH4 and CO2 Emissions from Petroleum Systems (USEPA 2017a).
| Segment/Source | Activity Data– Table 3.5-5: Activity Data for Petroleum System Sources | Average CH4 Emission Factors– Table 3.5-3: Average CH4 Emission Factors (kg/unit activity) for Petroleum Systems and Sources | CH4 Emissions (kt/yr)– Table 3.5-2: CH4 Emissions (kt) for Petroleum Systems |
| Fugitive Emissions | |||
| Oil Wellheads (heavy crude) | 41376 No. of hvy. crude wells | 0.9 kg/well | 0.04 |
| Oil Wellheads (light crude) | 545520 No. of lt. crude wells | 116.9 kg/well | 63.8 |
| Segment/ Source | Activity Data– Table 3.6-7: Activity Data for Natural Gas System Sources | Average CH4 Emission Factors– Table 3.6-2: Average CH4 Emission Factors (kg/ unit activity) for Natural Gas Systems and Sources | CH4 Emissions (kt/yr)– Table 3.6-1: CH4 Emissions (kt) for Natural Gas Systems, by Segment and Source |
| Gas Wells | |||
| Non-associated Gas Wells (less fractured wells) | 179658 wells | 88.8 kg/well | 16 |
| Gas Wells with Hydraulic Fracturing | 242235 wells | 142.7 kg/well | 34.6 |
The wellhead is a collection of valves and tubing that are designed to allow fluids and gases from the formation to flow up the well in a safe and controlled manner. As a collection of valves and tubing, along with pressure gauges or sensors, there is an opportunity for fugitive methane emissions from connections and valve packing. Wells may accumulate significant liquids over time that are not brought to surface, which must be “unloaded” because they can affect well performance. This process is called liquids unloading. Both the fugitive emissions and emissions from liquids unloading maintenance activities are identified under the federal GHG reporting program.
B.1.2 Well completion
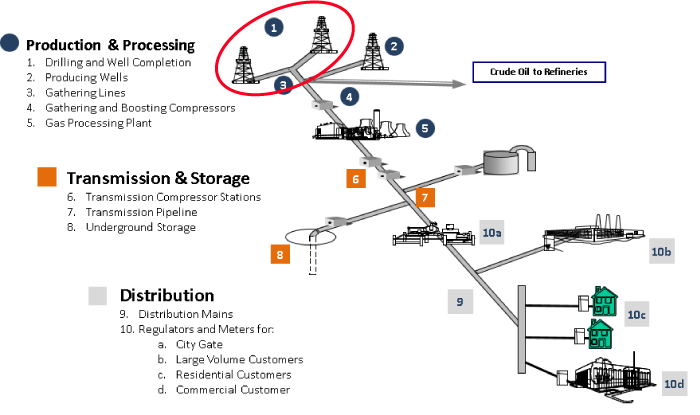
Figure 50. Well completion.
Source: Adapted from the American Gas Association and EPA Natural Gas STAR Program
Table 10. Natural gas and petroleum system supply chain nomenclature in different programs – well completion.
Source: Inventory of U.S. Greenhouse Gas Emissions and Sinks: 1990-2015 (USEPA 2017a).
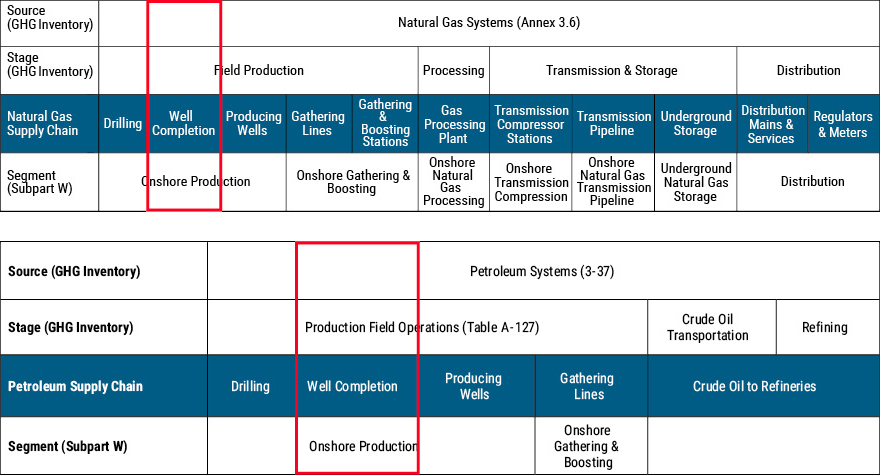
Well completion is the process of making a newly drilled well ready for production of oil and/or natural gas. This stage includes fracturing the well, the use of green completion components, flaring, and the use of condensate/produced water tanks.
Table 11. 2015 Fugitive methane emissions from oil field operations – well completion.
Source: Adapted from USEPA ANNEX 3.5, Methodology for Estimating CH4 and CO2 Emissions from Petroleum Systems (USEPA 2017a).
| Segment/ Source | Activity Data– Table 3.5-5: Activity Data for Petroleum System Sources, for2015 | Average CH4 Emission Factors– Table 3.5-3: Average CH4 Emission Factors (kg/unit activity) for Petroleum Systems and Sources | CH4 Emissions (kt/yr)– Table 3.5-2: CH4 Emissions (kt) for Petroleum Systems |
| Vented Emissions | |||
| Well Completion Venting (less HF Completions) | 4,227 Oil well completions | 14.1 kg/event | 0.1 |
| Well Workovers | 44,017 Oil well workovers | 1.8 kg/event | 0.1 |
| HF Well Completions, Uncontrolled | 10,719 HF oil well completions | 6763.1 kg/event | 72.5 |
| HF Well Completions, Controlled | 807 HF oil well completions | 338.2 kg/event | 0.3 |
| Segment/ Source | Activity Data– Table 3.6-7: Activity Data for Natural Gas System Sources | Average CH4 Emission Factors– Table 3.6-2: Average CH4 Emission Factors (kg/ unit activity) for Natural Gas Systems and Sources | CH4 Emissions (kt/yr)– Table 3.6-1: CH4 Emissions (kt) for Natural Gas Systems, by Segment and Source |
| Drilling, Well Completion, and Well Workover | |||
| Gas Well Completions without Hydraulic Fracturing | 762 completions/year | 14.9 kg/completion | 0.01 |
| Gas Well Workovers without Hydraulic Fracturing | 7815 workovers/year | 50.6 kg/workover | 0.4 |
| Hydraulic Fracturing Completions and Workovers that vent | 139 completions and workovers/year | 36824.7 kg/(compl. & workover) | 5.1 |
| Flared Hydraulic Fracturing Completions and Workovers | 341 completions and workovers/year | 4906.8 kg/(compl. & workover) | 1.7 |
| Hydraulic Fracturing Completions and Workovers with RECs | 3323 completions and workovers/year | 3241.5 kg/(compl. & workover) | 10.8 |
| Hydraulic Fracturing Completions and Workovers with RECs that flare | 1,847 completions and workovers/year | 4876.9 kg/(compl. & workover) | 9 |
| Well Drilling | 18,837 wells | 52.1 kg/well | 1 |
B.1.2.1 Green completion equipment
After a well completion or workover, the formation and well bore is cleaned of fracture fluid and debris. Conventionally, this debris and fluid is collected into open pits or tanks, and the gas entrapped in the fluid and cuttings is vented or flared. Green completions are methods used to lower these methane losses during well completions and workovers. When using green completion equipment, gas and hydrocarbon liquids are physically separated (separated from other fluids and cuttings) and captured.
Green completion equipment is generally comprised of a choke manifold, separator, temporary piping connections, and other pressure regulating equipment. Such connections are made using hammer unions, and are pressure tested for significant leakage (and other performance issues) prior to use. These connections are anticipated to leak to some degree and it is unclear if the emission factors utilized to estimate methane emissions for production are suitable for quantifying emissions from completions equipment. In addition, completion equipment can include a “gas buster” tank that allows the operator to blow down equipment if they experience sand buildup or other operational issues. When equipment is blown down to the “gas buster,” any natural gas entrained in the flowback fluid is released to the atmosphere.
B.1.2.2 Flare
Flares are used to dispose of gas released during completion or production. Flares have an open flame and are generally equipped with a pilot flame fueled using gas or lit by an electronic ignitor. Flares come in a variety of heights and configurations and can be used on high and low-pressure gas streams. Constituents of the flared gas may have widely varying destruction efficiencies depending on the waste stream being combusted, gas volume, and velocity.
Flare emissions are typically a function of the destruction efficiency, so if a flare is 98% efficient, then 2% of the waste stream is released uncombusted. In addition, malfunctions of the pilot flame or electronic ignition system can result in uncontrolled vented emissions of gas to the atmosphere. In addition, flares utilized during completion operations can be mobile, and as such are connected to completion equipment using temporary piping. See Section B.1.2.1 Green completion equipment for a description of potential fugitive methane sources.
B.1.2.3 Condensate and produced water tanks
Table 12. 2015 Fugitive methane emissions from natural gas production – condensate.
Source: Adapted from USEPA ANNEX 3.5, Methodology for Estimating CH4 and CO2 Emissions from Petroleum Systems (USEPA 2017a).
| Segment/ Source | Activity Data– Table 3.6-7: Activity Data for Natural Gas System Sources | Average CH4 Emission Factors– Table 3.6-2: Average CH4 Emission Factors (kg/ unit activity) for Natural Gas Systems and Sources | CH4 Emissions (kt/yr)– Table 3.6-1: CH4 Emissions (kt) for Natural Gas Systems, by Segment and Source |
| Condensate Tank Vents | |||
| Large Tanks w/Flares | 125605169 bbl | 0.01 kg/bbl | 0.7 |
| Large Tanks w/VRU | 24309731 bbl | 0.004 kg/bbl | 0.1 |
| Large Tanks w/o Control | 31995435 bbl | 0.2 kg/bbl | 5.4 |
| Small Tanks w/Flares | 18065193 bbl | 0.01 kg/bbl | 0.1 |
| Small Tanks w/o Flares | 35911041 bbl | 0.5 kg/bbl | 17.2 |
| Malfunctioning Separator Dump Valves | 181910334 bbl | 0.0003 kg/bbl | 0.1 |
Condensate and produced water tanks used in the oil and natural gas production sector are shop fabricated and transported to the site for installation. Both the federal GHG reporting program and new source performance standards (NSPS) include methods for quantification of methane emissions from such tanks. Briefly, emissions result from three overall processes: flash, working, and breathing. Flash emissions are evolved when a pressurized fluid stream flows into an atmospheric tank. The resulting change in pressure releases gasses, including methane, previously held in solution. Working losses result from tank fluid level changes that push vapors trapped in the tank head space to escape to the atmosphere or to an emission collection system. Breathing losses occur as the ambient temperature changes and fluids in the tank expand, which can push vapors trapped in the tank head space to escape to the atmosphere or to an emission collection system.
B.1.3 Producing Wells
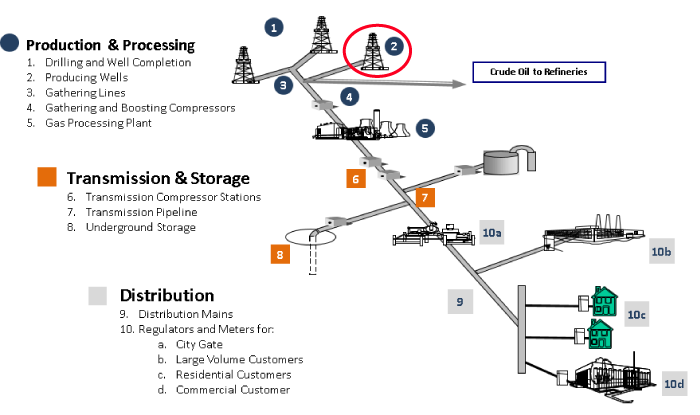
Figure 51. Producing wells.
Source: Adapted from the American Gas Association and EPA Natural Gas STAR Program
Table 13. Natural gas and petroleum system supply chain nomenclature in different programs – producing wells.
Source: Inventory of U.S. Greenhouse Gas Emissions and Sinks: 1990-2015 (USEPA 2017a).
B.1.3.1 Oil Production Field Production
Of the four sectors of natural gas systems (i.e., production, processing, transmission/storage, and distribution), production accounted for ±62% of emissions in 2014 (USEPA 2017a). One study found that 61% of production emissions were from pneumatic controllers and 30% were from equipment leaks. It should be noted that the USEPA inventory considers gathering and boosting within the production sector whereas in this ITRC report, production is considered part of the transmission sector.
Production emissions are broken down as those from the following six activities: flowback, pumps, pneumatic controllers, equipment leaks, liquid unloading, and workovers. A discussion of the life cycle of production emissions including drilling, fracturing, well completion, and production will follow.
B.1.3.2 Natural Gas Production from Oil Wells
All production activities the general public sees begin with the drilling of the well to access an oil-producing geologic formation. Historically, oil well production was limited to vertical wells and initially to relatively shallow depth. Fracturing of productive strata has also been employed for many years. Recent technological advances first seen only on offshore drilling rigs, like directional drilling, have been adopted by onshore operators. That innovation, coupled with advanced well stimulation (or completion) techniques like hydraulic fracturing has enabled onshore oil producers (Exploration and Production or E&P companies) to access formations that were previously inaccessible, considered not economical using prior drilling technology, or both. These advancements in technology have resulted in a significant shift in the economy of the United States, moving in the course of a decade from a state of relative resource scarcity to becoming one of the largest producers of natural gas worldwide. This change presents both opportunities and challenges. One of these challenges is how best to control emissions while utilizing this new energy economy. Emissions of methane from oil production contribute to this issue of climate change, and as a consequence have been the subject of regulation at the state and federal level.
The federal GHG reporting program established in 40 Code of Federal Regulations Part 98, Subpart W – Petroleum and Natural Gas Systems is focused on capturing GHG emissions data (specifically including methane) from oil and natural gas production. It captures a number of known sources of direct and indirect methane emissions, which are listed in the subpart (USEPA 2009).
B.1.3.3 Natural Gas Field Production
Table A-134 from the EPA Greenhouse Gas Inventory, lists many emissions activities for gas and condensate production operations and for midstream operations (USEPA 2014).
In alignment with the EPA GHG Inventory, onshore production operations will include:
- Gas Wells
- Well Pad Equipment
- Drilling
- Well Completion and Well Workover
- Normal Operations
- Condensate Tank Vents
- Compressor Exhaust Vented
- Well Cleanups
- Blowdowns (except pipeline blowdowns which are part of midstream)
- Upsets
- Produced Water from CBM Wells
Table 14. 2015 Fugitive methane emissions from natural gas production – producing wells.
Source: Adapted from USEPA ANNEX 3.5, Methodology for Estimating CH4 and CO2 Emissions from Petroleum Systems (USEPA 2017a).
| Segment/ Source | Activity Data– Table 3.6-7: Activity Data for Natural Gas System Sources | Average CH4 Emission Factors– Table 3.6-2: Average CH4 Emission Factors (kg/ unit activity) for Natural Gas Systems and Sources | CH4 Emissions (kt/yr)– Table 3.6-1: CH4 Emissions (kt) for Natural Gas Systems, by Segment and Source |
| Gas Wells | |||
| Non-associated Gas Wells (less fractured wells) | 179,658 wells | 88.8 kg/well | 16 |
| Gas Wells with Hydraulic Fracturing | 242,235 wells | 142.7 kg/well | 34.6 |
| Well Pad Equipment | |||
| Heaters | 87,087 heaters | 249.3 kg/heater | 21.7 |
| Separators | 289,046 separators | 404.8 kg/separator | 117 |
| Dehydrators | 11,235 dehydrators | 486.9 kg/dehydrator | 5.5 |
| Meters/Piping | 361,753 meters | 211.6 kg/meter | 76.6 |
| Compressors | 33,026 compressors | 2,002.5 kg/compressor | 66.1 |
B.1.4 Gathering lines
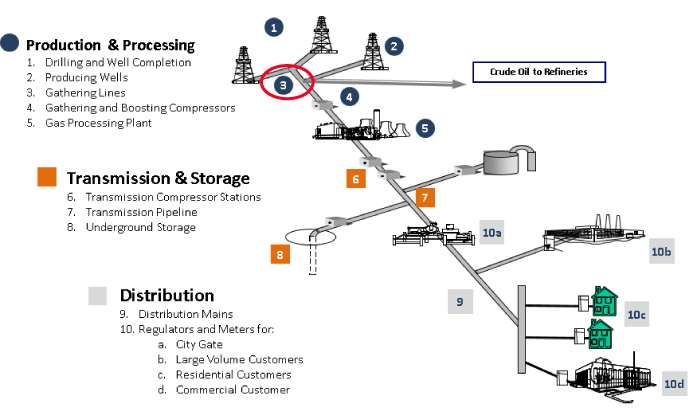
Figure 52. Gathering lines.
Source: Adapted from the American Gas Association and EPA Natural Gas STAR Program
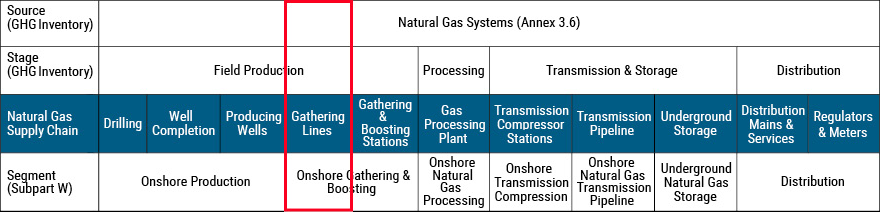
Table 15. Natural gas and petroleum system supply chain nomenclature in different programs – gathering lines.
Source: Inventory of U.S. Greenhouse Gas Emissions and Sinks: 1990-2015 (USEPA 2017a).
Midstream operations will include:
- Gathering and Boosting Compressor Stations
- Pipeline Leaks
- Pipeline Blowdowns
Table 16. 2015 Fugitive methane emissions from natural gas production – gathering lines.
Source: Adapted from USEPA ANNEX 3.5, Methodology for Estimating CH4 and CO2 Emissions from Petroleum Systems (USEPA 2017a).
| Segment/ Source | Activity Data– Table 3.6-7: Activity Data for Natural Gas System Sources | Average CH4 Emission Factors– Table 3.6-2: Average CH4 Emission Factors (kg/ unit activity) for Natural Gas Systems and Sources | CH4 Emissions (kt/yr)– Table 3.6-1: CH4 Emissions (kt) for Natural Gas Systems, by Segment and Source |
| Gathering and Boosting | |||
| Gathering and Boosting Stations | 5,276 stations | 373,048.7 kg/station | 1,968.20 |
| Pipeline Leaks | 408,465 miles | 395.5 kg/mile | 161.6 |
Gathering pipelines transport natural gas from well pads to processing plants or transmission pipelines. The EPA U.S. Greenhouse Gas Inventory estimates that there are approximately 420,000 miles of gathering pipelines in the country (USEPA 2017a). Gathering lines are associated with small, aboveground auxiliary equipment such as pipeline interconnections and pigging stations. Gathering stations are larger associated facilities where gas is compressed and occasionally treated to remove liquids or acid gases. Gathering station emissions are well characterized, but very little data exist on emissions from gathering pipelines or small auxiliary equipment. There are two recent studies that have assessed emissions from gathering pipelines but have not been published yet. A study by the National Energy Technology Laboratory used a utility terrain vehicle equipped with a methane sensor to detect methane emissions along 138 miles of gathering pipeline right of way in Pennsylvania. Preliminary results indicate that only one leak was detected during the survey from a blowdown valve associated with aboveground equipment. As part of the Research Partnership to Secure Energy for America (RPSEA) Fayetteville Shale Campaign, 60 miles of gathering pipelines and 95 auxiliary equipment locations were screened with a vehicle-mounted leak detection system (RPSEA 2016b); (RPSEA 2016a). Pipeline leaks were quantified with a flux chamber. Aboveground leaks were identified with optical gas imaging (OGI) and then quantified with a high-flow dilution sampler. For aboveground pigging stations, 75% of locations had detected emissions with an aggregate total of 0.7 kg/hr CH4. For aboveground block valves, 44% of sites had detected emissions with an aggregate total of 0.1 kg/hr CH4. For both pigging stations and block valves, the top 5% of locations accounted for 50% of total emissions. Only a single pipeline leak was detected, but its emissions rate of 4 kg/hr CH4 exceeded the total of all aboveground leaks. Although these initial studies suggest that gathering pipeline emissions are small, their very small coverage (<0.05%) of total pipeline miles and finding of highly skewed emission rates indicates that more work is needed to accurately assess emissions from this source.
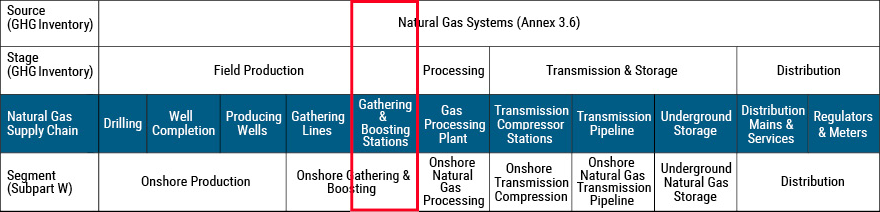
B.1.5 Gathering and boosting compressors
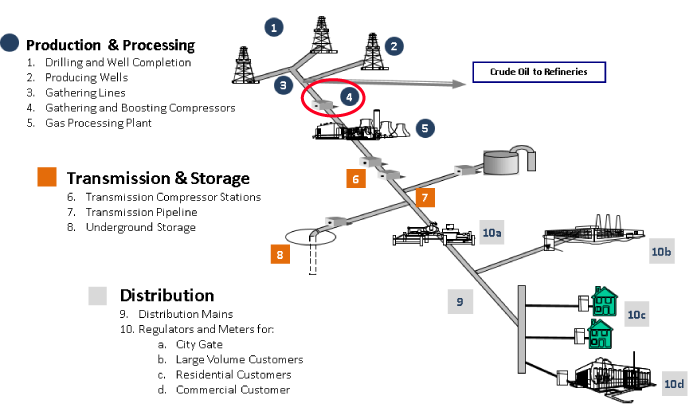
Figure 53. Gathering and boosting compressors.
Source: Adapted from the American Gas Association and EPA Natural Gas STAR Program
Table 17. Natural gas and petroleum system supply chain nomenclature in different programs – gathering and boosting stations.
B.1.5.1 Gathering and Boosting Stations
Table 18. 2015 Fugitive methane emissions from natural gas production – gathering and boosting.
Source: Adapted from USEPA ANNEX 3.5, Methodology for Estimating CH4 and CO2 Emissions from Petroleum Systems (USEPA 2017a).
| Segment/ Source | Activity Data– Table 3.6-7: Activity Data for Natural Gas System Sources | Average CH4 Emission Factors– Table 3.6-2: Average CH4 Emission Factors (kg/ unit activity) for Natural Gas Systems and Sources | CH4 Emissions (kt/yr)– Table 3.6-1: CH4 Emissions (kt) for Natural Gas Systems, by Segment and Source |
| Gathering and Boosting | |||
| Gathering and Boosting Stations | 5,276 stations | 373,048.7 kg/station | 1,968.20 |
| Pipeline Leaks | 408,465 miles | 395.5 kg/mile | 161.6 |
Gathering stations are facilities that collect, compress, and sometimes treat natural gas from multiple wells and send the gas to processing plants or transmission pipelines.
Gathering lines are commonly smaller diameter pipelines (generally in the range of 6 to 20 inches) that move natural gas from the wellhead to a natural gas processing facility or an interconnection with a larger mainline transmission pipeline. “Gathering & boosting” compressor stations (SIC 1311) for gathering lines are often larger than transmission line compressor stations (SIC 4922) due to multiple pipelines coming into the station inlet, and in some cases, additional equipment needed to filter and remove liquids from the gas stream. Glycol dehydrators remove water, and Amine units remove CO2 and H2S, from the gas stream.
Midstream, gathering and boosting compressor stations receive gas from the surrounding gathering field. The gas can enter the facility at various pressures depending on the gas gathering pipeline(s) pressure(s). The gas is routed to separators (or slug catchers) to knock out heavier hydrocarbon liquids and water which are routed to either pressurized condensate stabilizers or to atmospheric storage tanks. Those liquids will ultimately be loaded onto trucks for transportation or piped offsite. The gas from the inlet separator is routed to compression.
Prior to 2016, EPA’s estimate of gathering stations emissions was split into three categories: stations, small compressors, and large compressors. This was based on data from the 1990s EPA/ Gas Research Institute (GRI) study that included measurements from well pad compressors and gathering stations. Total emissions from these sources were estimated to be 226 Gg CH4 in the EPA 2014 Greenhouse Gas Inventory (GHGI) (USEPA 2014). The 2016 EPA GHGI replaced this estimate with a single value for gathering stations based on a study by Colorado State University (CSU) (Roscioli et al. 2015); (Mitchell et al. 2015, Marchese et al. 2015). The study used the dual gas downwind tracer technique to quantify site-level methane emissions at 114 gathering stations operated by five companies in 10 basins. Emission rates ranged from 0.7 to 700 kg/hr CH4 with an average of 55 kg/hr. As a percentage of gas throughput, loss rates ranged from 0 to 70% with a weighted average of 0.2%. Emissions were highly skewed with 30% of facilities responsible for 80% of emissions. Onsite surveys with infrared camera revealed that 20% of facilities had substantial tank venting and these sites had on average four times higher emission rates than sites without substantial venting. (Mitchell et al. 2015) used a Monte Carlo simulation to estimate national emissions from the data. They estimate that in 2012 there were 4,549 gathering facilities in the U.S. with total emissions of 1,697 Gg CH4, or 0.40% of gas throughput. In the 2016 GHGI, USEPA used this data to estimate gathering station emissions of 1,865 Gg CH4, which makes gathering stations the largest single source in petroleum and natural gas systems.
Although the CSU study did not quantify component-level emissions, gathering stations likely have a similar profile as transmission compressor stations with the largest sources including compressor venting, compressor exhaust, and equipment leaks. Other sources such as storage tanks, pneumatic controllers, and blowdowns may also contribute to substantial emissions at some facilities. Ongoing research at compressor stations may provide data on component-level emissions at gathering facilities. Additionally, the EPA GHG Reporting Program (GHGRP) has been revised to require reporting of emissions and activity data by gathering and boosting facilities, which are defined at the basin-level by the rule, starting in the 2016 reporting year.
B.1.5.2 Midstream – Gathering and Boosting Compressor Stations
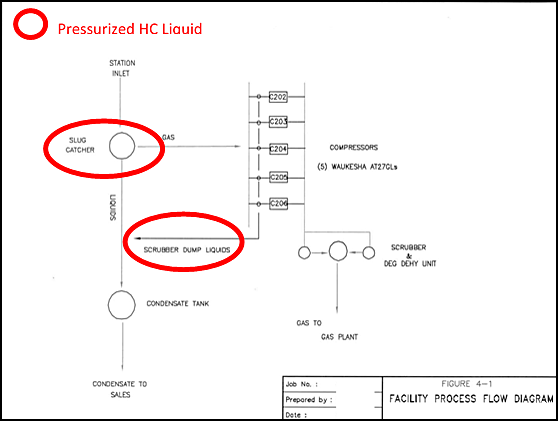
Figure 54. Compressor station – simplified process flow diagram.
Source: Provided by USEPA.
Compressor stations are an integral part of the natural gas pipeline network that moves natural gas from individual producing well sites to end users. As natural gas moves through a pipeline, distance, friction, and elevation differences slow the movement of the gas, and reduce pressure. Compressor stations are placed strategically within the gathering and transportation pipeline network to help maintain the pressure and flow of gas to market (USEPA 2017a). A simplified facility process flow diagram of an example compressor station is shown in Figure 54. Photos in Figures 55 and 56 indicate typical compressor station equipment.
Gathering lines are commonly smaller diameter pipelines (generally in the range of 6 to 20 inches) that move natural gas from the wellhead to a natural gas processing facility or an interconnection with a larger mainline transmission pipeline. “Gathering & boosting” compressor stations (SIC 1311) for gathering lines are often larger than transmission line compressor stations (SIC 4922) due to multiple pipelines coming into the station inlet, and in some cases, additional equipment needed to filter and remove liquids from the gas stream. Glycol dehydrators remove water, and amine units remove CO2 and H2S, from the gas stream.
Midstream, gathering and boosting compressor stations receive gas from the surrounding gathering field. The gas can enter the facility at various pressures depending on the gas gathering pipeline(s) pressure(s). The gas is routed to separators (or slug catchers) to knock out heavier hydrocarbon liquids and water, which are routed to either pressurized condensate stabilizers or to atmospheric storage tanks. Those liquids will ultimately be loaded onto trucks for transportation or piped offsite. The gas from the inlet separator is routed to compressors.
Compressors can use gas or electric engines (or gas turbines, which are seen more often in transmission pipeline compressor stations with more steady loads) to drive the compressors that increase the gas pressure for subsequent treatment. If the gas quality is adequate and does not require treatment, the compressors will directly tie into transmission pipelines for sale to market. Since compression raises the gas temperature, the compressed gas is cooled between stages; the larger the difference between inlet pressure and outlet pressure of the facility, the more stages of compression are needed. The inter-stage coolers typically result in some partial condensation that is removed in inter-stage scrubbers. These condensed hydrocarbon liquids, which can be at increasingly higher pressures for each stage, are routed to condensate stabilizers or atmospheric storage tanks where flash, working, standing, and breathing emissions occur. Compression also includes associated equipment such as air cooler/heat exchangers (to cool the gas stream between each stage of compression), inter-stage scrubbers (to remove hydrocarbon liquids from the cooled gas stream between each stage of compression), lube oil systems, filters, coalescers, etc. Malfunctioning valves on the inter-stage scrubbers can allow for continuous gas seepage, or unintentional gas carry through, which would be evident from the destination of those liquids (e.g., the storage tanks).
If water is present after compression, it is removed from the gas by glycol dehydrators, which can have two potential vented emissions:
- from a flash tank if present (and not routed to fuel the reboiler) and
- from the regenerator/still vent/reboiler stream
If permits or regulations require the reduction of emissions from tanks and glycol dehydrators, then those emissions will be routed through a closed vent system to either a Vapor Recovery Unit (VRU) to be recompressed and routed to the facility inlet, or to a combustor or flare control device. The dry, compressed gas leaves the compressor station at a high enough pressure for further gas processing at a gas plant or, if the quality of the gas can meet pipeline specs, can tie directly into a transmission, mainline pipeline for sales to market. To meet transmission pipeline specs, the high pressure gas may need to be routed through a JT (Joule-Thompson) skid or dewpoint control skid where further hydrocarbon liquid dropout can occur. These high-pressure liquids can be routed to a condensate stabilizer or the atmospheric storage tanks. The higher the pressure differential, the more flash emissions will occur.
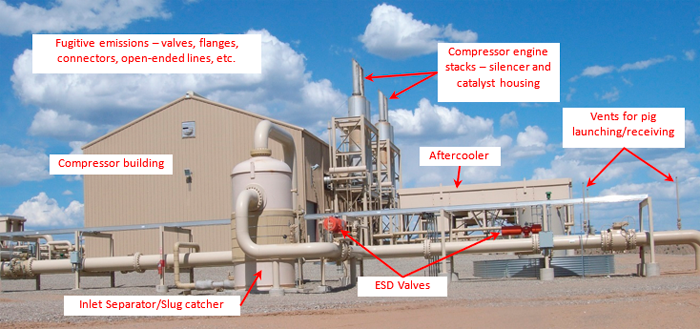
Figure 55. Compressor station – inlet and compressor building.
Source: Provided by USEPA.
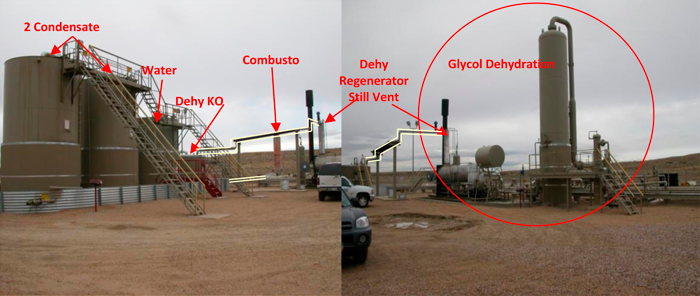
Figure 56. Compressor station – glycol dehydrator skid, storage tanks. Emissions from dehydrator and tanks are routed through a closed vent system (outlined in yellow) to a combustor control device.
Source: Provided by USEPA.
Currently in the USEPA GHGI Table A-134, methane emissions at gathering and boosting compressor stations, between the production wells and the gas processing plant, are captured in a single line item. Methane emission sources that could be detected include:
Intentional venting:
- Hydrocarbon liquid storage tanks, glycol dehydrator regenerators/reboilers and flash tanks, and amine units that are not required to control their emissions (Figure 60)
- Compressor distance piece vent/drain (Figure 62)
- Compressor crankcase vent
- Compressor rod packing vent/drain
- Gas-powered pneumatic devices – controllers, chemical pumps
- Blowdown emissions to remove gas from equipment for maintenance (Figure 57 and 58)
- Emergency Shutdown (ESD) events
Unintentional:
- Fugitive emissions from valves, flanges, connectors, open-ended lines (Figure 59)
- Hydrocarbon liquid storage tanks, glycol dehydrator regenerators/reboilers and flash tanks, and amine units that are required to control their emissions – through pressure relief devices like thief hatches and pressure relief valves (Figures 59 and 60)
- Excessive distance piece venting from unintentional gas carry through (Figure 62)
- Malfunctioning pneumatic devices
- Blowdown emissions due to improperly seated valves in blowdown piping (see Figures 61 and 62).
- ESD vent emissions due to improperly seated valves
- Unburned hydrocarbons, methane slip from any equipment that burns “waste gas” or fuel gas streams (e.g., combustors, flares, engines, turbines, reboilers, heaters, etc.) (Figures 61 and 63).
Every station has an ESD system connected to a control system that can detect abnormal conditions such as an unanticipated pressure drop or natural gas leakage. These emergency systems will automatically stop the compressor units and isolate and vent compressor station gas piping (sometimes referred to as a blow down). There can be individual blowdown stacks per compressor unit or a single, central blowdown stack for the entire compressor station. Valves within the piping system linked to a blowdown stack can sometimes not close completely and gas can seep out of the blowdown stacks (see Figures 57 and 58).
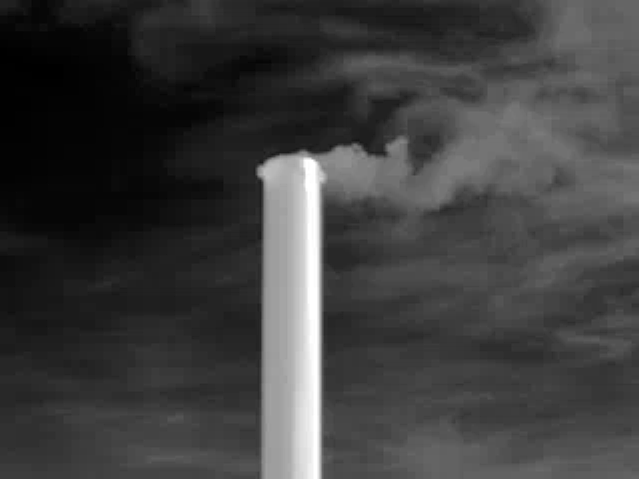
Figure 57. Centralized blowdown stack in a compressor station where several pieces of equipment are piped to.
Source: Provided by USEPA.
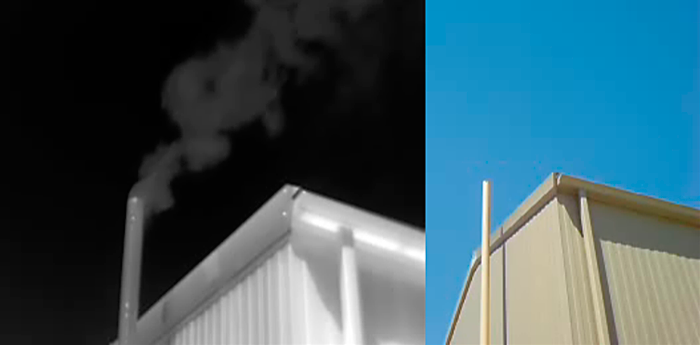
Figure 58. Blowdown stack by individual compressor unit (inside building).
Source: Provided by USEPA.
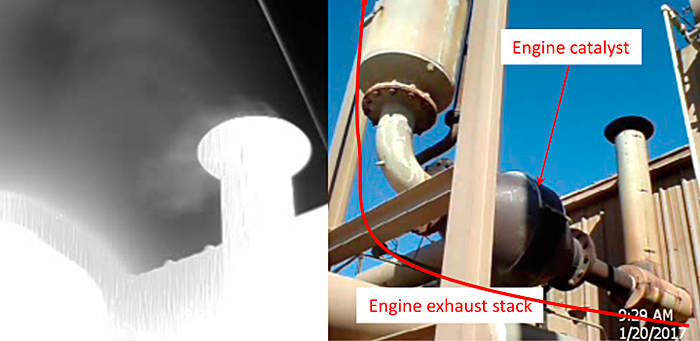
Figure 59. Engine emissions escaping before the emission control catalyst.
Source: Provided by USEPA.
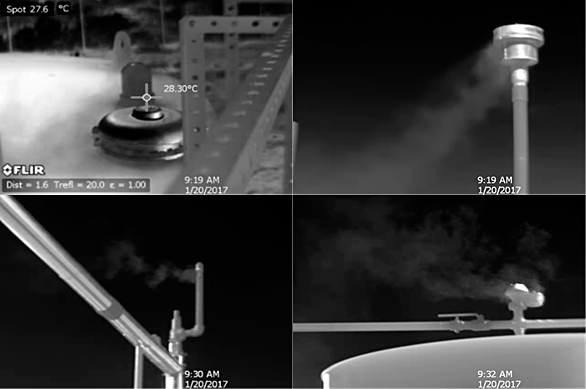
Figure 60. Emissions from closed vent systems that route emissions to a control device. Top left clockwise: tank thief hatch; spark arrestor on dehydrator knockout tank; pressure relief valve on dehydrator regenerator stream; tank pressure relief valve.
Source: Provided by USEPA.
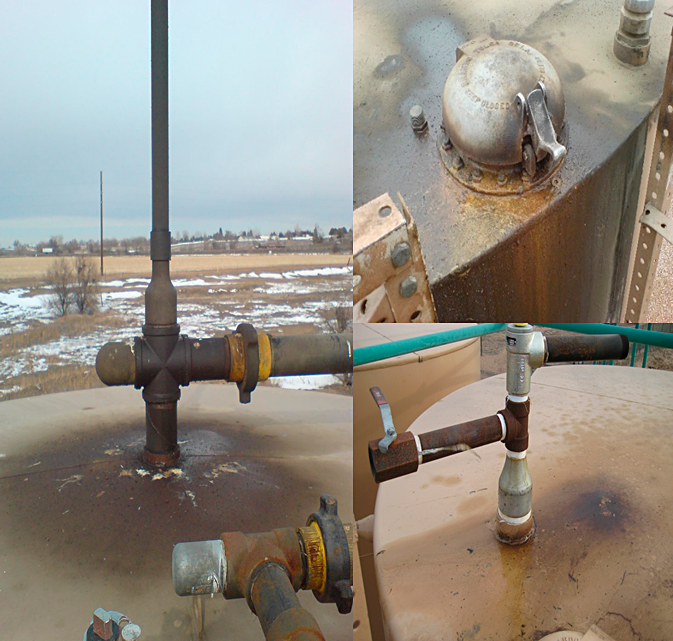
Figure 61. From visual observations, examples of “burped up” oil under and around pressure relief devices (thief hatches or valves) of controlled tanks at compressor stations, indicative of over-pressure events where gas emissions would also be present.
Source: Provided by USEPA.
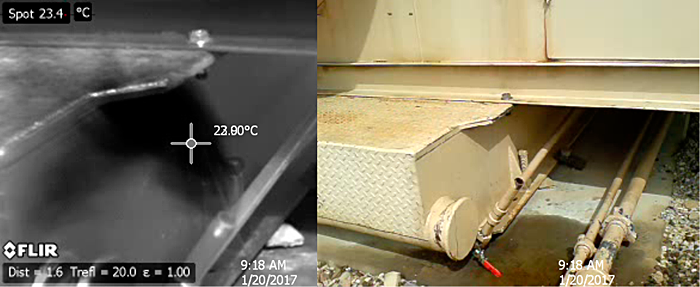
Figure 62. Distance piece drain vent from single compressor. Note sprayed and pooled oil underneath vent.
Source: Provided by USEPA.
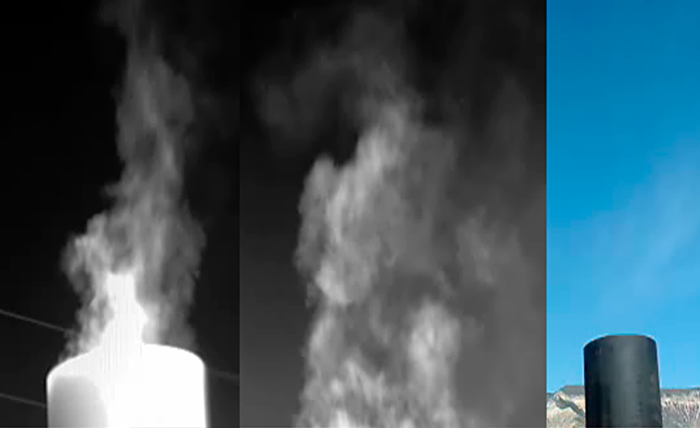
Figure 63. Potentially unburned hydrocarbons observed from an enclosed flare/combustor. Pan IR camera to move white hot stacks out of viewfinder to check if plume is hanging together.
Source: Provided by USEPA.
B.2 Processing – Gas Processing Plants
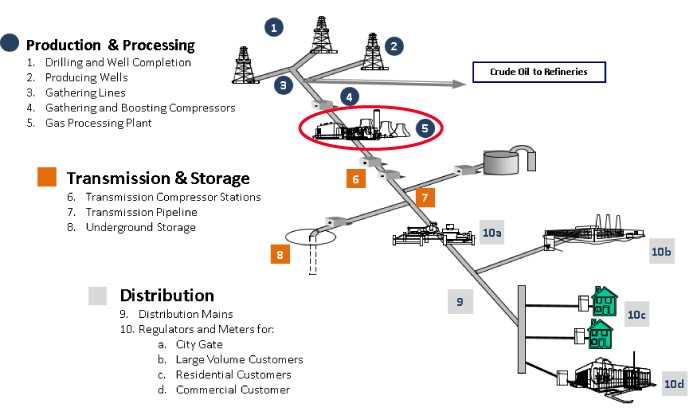
Figure 64. Gas processing plants.
Source: Adapted from the American Gas Association and EPA Natural Gas STAR Program
Table 19. Natural gas and petroleum system supply chain nomenclature in different programs – gas processing plant.
Source: Inventory of U.S. Greenhouse Gas Emissions and Sinks: 1990-2015 (USEPA 2017a).
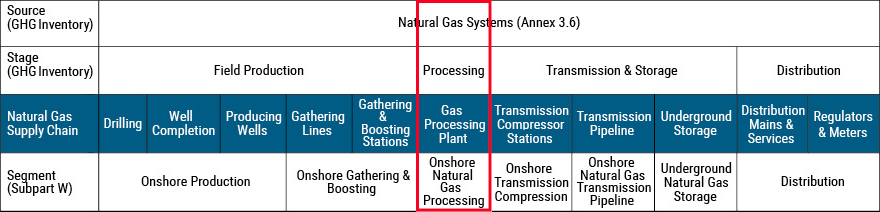
Table 20. 2015 Fugitive methane emissions from natural gas processing – gas processing plant.
Source: Adapted from USEPA ANNEX 3.5, Methodology for Estimating CH4 and CO2 Emissions from Petroleum Systems (USEPA 2017a).
| Segment/ Source | Activity Data– Table 3.6-7: Activity Data for Natural Gas System Sources | Average CH4 Emission Factors– Table 3.6-2: Average CH4 Emission Factors (kg/ unit activity) for Natural Gas Systems and Sources | CH4 Emissions (kt/yr)– Table 3.6-1: CH4 Emissions (kt) for Natural Gas Systems, by Segment and Source |
| Fugitives, Vented, and Combusted | |||
| Plant Fugitives | 667 plants | 24,134.2 kg/plant | 16.1 |
| Reciprocating Compressors | 3,802 compressors | 18,646.9 kg/compressor | 70.9 |
| Centrifugal Compressors (wet seals) | 377 compressors | 56,827.6 kg/compressor | 21.4 |
| Centrifugal Compressors (dry seals) | 306 compressors | 29,985.5 kg/compressor | 9.2 |
| Dehydrators | 667 plants | 25,335.6 kg/plant | 16.9 |
| Flares | 667 plants | 32,634.3 kg/plant | 21.8 |
| Normal Operations | |||
| Gas Engines | 50,243 MMHPhr | 4,622.4 kg/MMHPhr | 232.2 |
| Gas Turbines | 38,933 MMHPhr | 109.8 kg/MMHPhr | 4.3 |
| AGR Vents | 338 AGR units | 42,762.9 kg/AGR | 14.5 |
| Kimray Pumps | 3,288,400 MMscf/yr | 20.3 kg/MMscf | 66.8 |
| Dehydrator Vents | 3,690,685 MMscf/yr | 5.6 kg/MMscf | 20.8 |
| Pneumatic Devices | 667 gas plants | 3,172.5 kg/plant | 2.1 |
| Routine Maintenance | |||
| Blowdowns/ Venting | 667 gas plants | 53,219.3 kg/plant | 35.5 |
B.2.1. Cryogenic fractionation process
Field natural gas entering from well pads or gathering stations first enters separators (or slug catchers) to knock out heavier hydrocarbon liquids and water. By removing excess field water, the separator provides operating flexibility in the case of wells sending a large volume of fluids to the facility in a relatively brief amount of time (a “slug”). This fluid, composed primarily of entrained or residual produced water and natural gas liquids (NGL), may be further separated and sent to storage in atmospheric tanks.
The incoming gas stream is further dehydrated using a dessicant system, which can be regenerated onsite. Low (less than 10 ppm) moisture levels are required to avoid condensation issues in the cryogenic process. The dehydrated gas is then sent to a turboexpander (also referred to as an expander-compressor) where the gas is compressed and then allowed to depressurize inside a temperature-controlled cryogenic tower. The depressurization of the dehydrated gas under controlled conditions results in the separation of methane, which remains gaseous at the temperature and pressure of the tower, from the remaining NGL species (i.e., ethane, propane, butane, and hydrocarbons containing five or more carbon atoms). The methane comes off the top of the tower and is sent to residual compressors (residual gas). Depending on the availability of takeaway capacity or market, some cryogenic plants operate in an “ethane rejection” mode, where the ethane is sent to residual compression along with methane for compression and shipment to transmission. Where available, ethane can be separated and sold as a commodity. The remaining NGL (i.e., propane, butane, and C5+) are then stored in pressurized bullet tanks as a mixed intermediate product, commonly referred to as “Y-grade”. This Y-grade is the feedstock for the next processing step, fractionation. Some sites perform this processing as an integrated facility, in other cases the Y-grade is transported to the fractionation plant by truck or pipeline.
B.2.2. NGL fractionation
NGL fractionation is a distillation under temperature-controlled conditions. The mixed feedstock is processed through distillation towers of varying temperatures and refluxed to ensure efficient product recoveries. There are generally three commodity products produced in this operation: propane, butane, and “natural gasoline” (a mixture of C5+ hydrocarbons). Natural gasoline is typically stored in a floating-roof tank, whereas propane and butane are stored in pressurized bullet tanks. Natural gasoline can be utilized by refineries as a process material or additive, and also by the fuel ethanol industry as a denaturant. The separated products are generally shipped off-site via pipeline or rail car.
Cryogenic processing and fractionation of NGL both require very precise pressure and temperature control. Cryogenic plants have potential methane emissions from the raw gas and separated methane streams. In contrast, methane emissions from fractionation plants of any significance are unlikely. Sources of emissions are described below, and in some cases reference earlier subsections of this section due to similarity of operations.
B.2.3. Flares
Both cryogenic and fractionation processes are equipped with one or multiple flares to handle essentially two conditions: routine operations where relatively small volumes of gas are required to be controlled for operational or safety reasons, and emergency flares, which are typically an order of magnitude larger and designed to handle a large volume of gaseous hydrocarbons in the case of a catastrophic incident. These flares are equipped with flame sensors, continuous pilot flames (and in some cases a redundant backup), and flow measuring equipment. As a result, they are less likely to operate without the presence of a pilot flame. In most respects, the general operation and control efficiency of a flare is the same as described earlier.
B.2.4. Facility blowdown
Both cryogenic and fractionation plants regularly blow down a portion of the plant for routine maintenance. Plants will also blow down to address non-routine maintenance or other operational issues. Specific to the cryogenic plant, such blowdowns have the potential to emit controlled or uncontrolled methane to the atmosphere depending on the design of the plant (whether the portion of the facility to be blown down is piped to a control device) and the volume and composition of the gas being evacuated.
B.2.5. Natural gas-fired heaters
Natural gas-fired heaters located at the facility would potentially be a source of leakage. Both cryogenic plants and fractionation plants employ thermal fluid heating systems, which require a process heater to heat that fluid. These process heaters (hot oil heaters or HOH) are typically fueled using natural gas, and as a result the piping components are subject to potential methane leakage.
B.2.6. Compressors
Compressors at these processing plants can be natural gas-driven or electrically driven when power is available and reliable. Employing electric drivers for such units eliminates potential emissions of methane from the fuel system, but emissions from scrubber bottles, intercoolers, and other functional components may still occur. Methane emissions from compressor operations were discussed earlier in this section. Loading operations for Y-grade in cases where a compressor is employed in vapor recovery service (like truck loading of Y-grade), the pressurized portion of the collection system is subject to potential leakage. Leaking connections in the vacuum portion of the system would result in a loss of capture efficiency and increase in emissions of other hydrocarbon vapors. Methane would not be a component of the liquid being loaded and as a result, emissions are not anticipated from this operation.
B.2.7. Tanks and vessels
Similar to discussions in prior sections, atmospheric tank emissions are a function of the pressure and composition of the incoming fluid stream. Atmospheric storage tanks at gas processing facilities may contain produced water or condensate. They may also be used as “slop tanks” where there is a mixture of different fluids in a single tank. Pressurized storage tanks (bullet tanks) are used to store propane and butane following fractionation. These hydrocarbons are gaseous at atmospheric pressure, and leaks from pressure vessels (like from an emergency relief valve) would not result in methane emissions.
B.3. Transmission and Storage
B.3.1. Transmission compressors
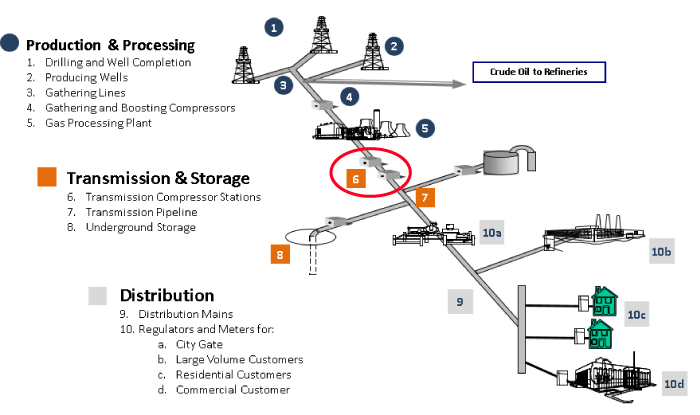
Figure 65. Transmission compressors.
Source: Adapted from the American Gas Association and EPA Natural Gas STAR Program
Table 21. Natural gas and petroleum system supply chain nomenclature in different programs – transmission compressors.
Source: Inventory of U.S. Greenhouse Gas Emissions and Sinks: 1990-2015 (USEPA 2017a).
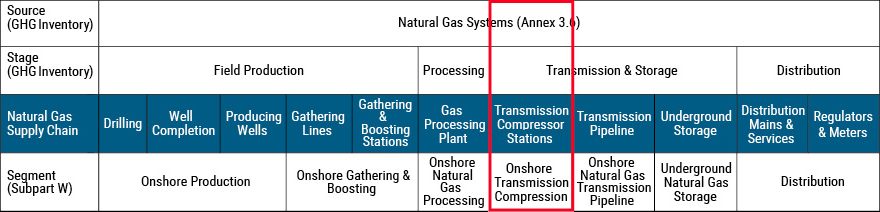
Table 22. 2015 Fugitive methane emissions from natural gas transmission – transmission compressors.
Source: Adapted from USEPA ANNEX 3.5, Methodology for Estimating CH4 and CO2 Emissions from Petroleum Systems (USEPA 2017a).
| Segment/ Source | Activity Data– Table 3.6-7: Activity Data for Natural Gas System Sources | Average CH4 Emission Factors– Table 3.6-2: Average CH4 Emission Factors (kg/ unit activity) for Natural Gas Systems and Sources | CH4 Emissions (kt/yr)– Table 3.6-1: CH4 Emissions (kt) for Natural Gas Systems, by Segment and Source |
| Compressor Stations (Transmission) | |||
| Station Total Emissions | 1,834 stations | 0 kg/station | 572.4 |
| Station + Compressor Fugitive Emissions | NA | 63,900 kg/station | 117.4 |
| Reciprocating Compressor | 5,221 compressors | 64,900 kg/compressor | 339.4 |
| Centrifugal Compressor (wet seals) | 838 compressors | 683,031.1 kg/compressor | 57 |
| Centrifugal Compressor (dry seals) | 1,334 compressors | 87,956.2 kg/compressor | 58.7 |
| Compressor Stations (Storage) | |||
| M&R (Trans. Co. Interconnect) | 2,682 stations | 28,007.1 kg/station | 75.1 |
| M&R (Farm Taps + Direct Sales) | 79,516 stations | 219.3 kg/station | 17.4 |
| Normal Operation | |||
| Dehydrator vents (Transmission) | 1,169,007 MMscf/yr | 1.8 kg/MMscf | 2.1 |
| Dehydrator vents (Storage) | 1,965,859 MMscf/yr | 2.3 kg/MMscf | 4.4 |
| Compressor Exhaust | |||
| Engines (Transmission) | 54,509 MMHPhr | 4,622.4 kg/MMHPhr | 252 |
| Turbines (Transmission) | 13,006 MMHPhr | 109.8 kg/MMHPhr | 1.4 |
| Engines (Storage) | 4,838 MMHPhr | 4,622.4 kg/MMHPhr | 22.4 |
| Turbines (Storage) | 1,699 MMHPhr | 109.8 kg/MMHPhr | 0.2 |
| Generators (Engines) | 2,667 MMHPhr | 4,622.4 kg/MMHPhr | 12.3 |
| Generators (Turbines) | 31 MMHPhr | 109.8 kg/MMHPhr | 0.003 |
| Pneumatic Devices Trans + Stor | |||
| Pneumatic Devices Transmission | 47,069 devices | 628.4 kg/controller | 29.6 |
| (High Bleed) | 5,220 devices | 2,802.7 kg/controller | 14.6 |
| (Intermittent Bleed) | 38,217 devices | 370 kg/controller | 14.1 |
| (Low Bleed) | 3,633 devices | 221.9 kg/controller | 0.8 |
| Pneumatic Devices Storage | 23,093 devices | 972.6 kg/controller | 22.5 |
| (High Bleed) | 6,870 devices | 2,359.2 kg/controller | 16.2 |
| (Intermittent Bleed) | 14,076 devices | 415.2 kg/controller | 5.8 |
| (Low Bleed) | 2,147 devices | 190.6 kg/controller | 0.4 |
| Station Venting Trans + Storage | |||
| Station Venting Transmission | 1,834 compressor stations | 83,954.3 kg/station | 154 |
| Station Venting Storage | 349 compressor stations | 83,954.3 kg/station | 29.3 |
B.3.2. Transmission pipelines
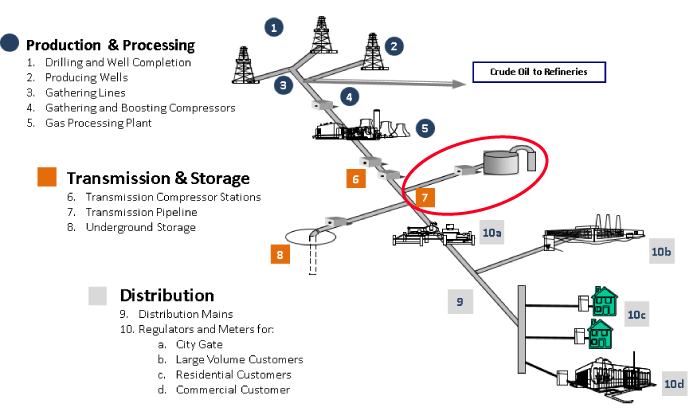
Figure 66. Transmission pipelines.
Source: Adapted from the American Gas Association and EPA Natural Gas STAR Program
Table 23. Natural gas and petroleum system supply chain nomenclature in different programs – transmission pipelines.
Source: Inventory of U.S. Greenhouse Gas Emissions and Sinks: 1990-2015 (USEPA 2017a).
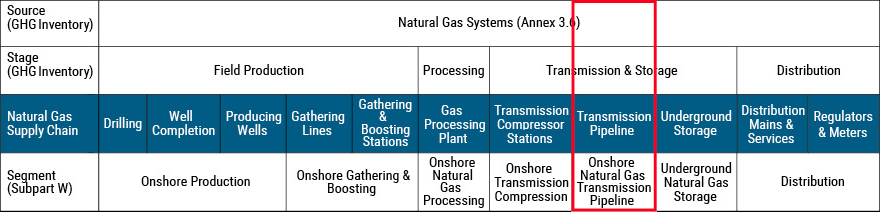
Table 24. 2015 Fugitive methane emissions from natural gas transmission – transmission pipelines.
Source: Adapted from USEPA ANNEX 3.5, Methodology for Estimating CH4 and CO2 Emissions from Petroleum Systems (USEPA 2017a).
| Segment/ Source | Activity Data– Table 3.6-7: Activity Data for Natural Gas System Sources | Average CH4 Emission Factors– Table 3.6-2: Average CH4 Emission Factors (kg/ unit activity) for Natural Gas Systems and Sources | CH4 Emissions (kt/yr)– Table 3.6-1: CH4 Emissions (kt) for Natural Gas Systems, by Segment and Source |
| Fugitives | |||
| Pipeline Leaks | 301,257 miles | 1,122.7 kg/mile | 3.3 |
| Routine Maintenance/Upsets | |||
| Pipeline venting | 301,257 miles | 609.6 kg/mile | 183.6 |
B.3.3 Underground storage
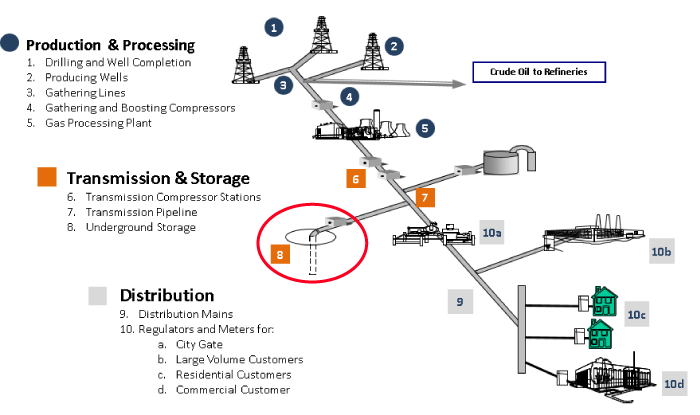
Figure 67. Underground storage.
Source: Adapted from the American Gas Association and EPA Natural Gas STAR Program
Table 25. Natural gas and petroleum system supply chain nomenclature in different programs – underground storage.
Source: Inventory of U.S. Greenhouse Gas Emissions and Sinks: 1990-2015 (USEPA 2017a).
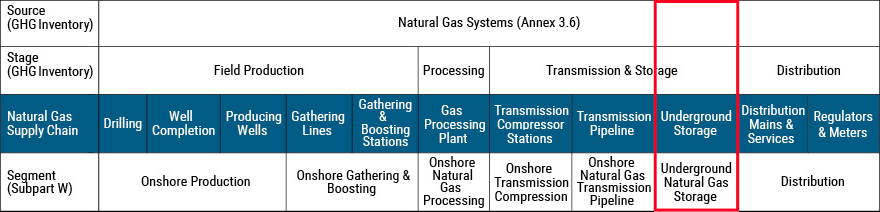
Table 26. 2015 Fugitive methane emissions from natural gas storage – underground storage.
Source: Adapted from USEPA ANNEX 3.5, Methodology for Estimating CH4 and CO2 Emissions from Petroleum Systems (USEPA 2017a).
| Segment/ Source | Activity Data– Table 3.6-7: Activity Data for Natural Gas System Sources | Average CH4 Emission Factors– Table 3.6-2: Average CH4 Emission Factors (kg/ unit activity) for Natural Gas Systems and Sources | CH4 Emissions (kt/yr)– Table 3.6-1: CH4 Emissions (kt) for Natural Gas Systems, by Segment and Source |
| Fugitives | |||
| Pipeline Leaks | 301,257 miles | 1,122.7 kg/mile | 3.3 |
| Wells (Storage) | 17,692 wells | 5,233.5 kg/well | 92.6 |
| Routine Maintenance/Upsets | |||
| Pipeline venting | 301,257 miles | 609.6 kg/mile | 183.6 |
| Station Venting Trans + Storage | |||
| Station Venting Storage | 349 compressor stations | 83,954.3 kg/station | 29.3 |
Storage of natural gas may use underground formations such as salt caverns, mines, aquifers, depleted reservoirs and hard-rock caverns (USEPA 2017a). These formations may extend a few hundred to several thousand feet below the surface. Wells connect the storage reservoir to the surface wellhead assembly through a system of valves and pipes.
The wells are constructed with a larger diameter casing around a smaller diameter pipe. The casing sections, also known as joints, are 30-40 feet long and typically screw together with engineered connection collars. The collars include thread compound to assist in sealing each joint. New storage wells contain a minimum of two casings, a surface casing and a production casing. Often, owners will also cement between the two casings.
There are many components that go into underground storage and may contribute to leaking including:
- Conductor casing
- Surface casing
- Intermediate casing
- Production casing
- Production tubing
The mechanism for leaks are breaches in the seals of one of the above components. The American Petroleum Institute (API 2016) found that the three primary leak mechanisms are:
- Wellhead component or seal failure;
- Production casing leak; or
- A downhole annular barrier breach (i.e., cement sheath)
These primary leak paths are described more fully below.
Wellhead component or seal failure. This leak path occurs when the primary and secondary seals in the wellhead fail, allowing gas in the production casing to migrate past the seals into the production casing annulus. Leaks can also occur as a result of mechanical failure of other wellhead components such as casing slips, which can allow the production casing to drop free of the wellhead seal assembly. Observations that indicate a potential leak may exist including an increase in annular pressure or flow, dependent on the annular valve position during normal well operation mode.
For a release to occur, an initial failure takes place allowing pressurized storage gas to leave the production casing. Gas then either exits through an open annular valve or pressures up the annulus, if closed. To eliminate this type of release to the atmosphere, some operators close the annular valve while the well is in operational mode. However, if pressurized gas is trapped in the annulus and not allowed to dissipate, there is a possibility of additional secondary failures that will lead to more complex, and difficult to control release paths, hence other operators leave the annular valves open in normal operational mode.
Diagnosing the failure mechanism requires the operator to perform one or more of the following operations: test wellhead seals, observe wellhead components for indications of leakage (e.g., noise and/or hydrate deposition), and/or perform interference testing between the production casing and production casing annulus to determine if the leak is at the surface or downhole. Leak resolution may include replacing the wellhead assembly or wellhead seals and/or repair or partial replacement of the production casing. Preventive measures such as wellbore integrity inspections, mechanical integrity testing, and annular barrier monitoring and evaluations may identify potential direct cause failure mechanisms before they occur.
Production casing leak. This leak path occurs when the production casing wall is breached. Causes include, but are not limited to, production casing failure due to reduced casing wall thickness from corrosion and/or the introduction of higher pressures than are containable for stimulation treatments, or production casing wall collapse from outside forces such as earth movement or foreign production operations.
Observations that indicate a potential leak may exist are lower than expected shut-in pressures or gas exiting somewhere outside of the structure of the wellbore.
The stored gas can escape outside the structure of the storage wellbore from deep underground and migrate through a path of least resistance upward until it reaches an alternative escape path. The escape path could be through an oil and gas, water, or abandoned well completed in a shallower permeable formation, or the path could be all the way to an escape at the surface. Operators must understand subsurface geologic conditions to assess the risk of geologic migration.
Diagnosing the failure mechanism requires the operator to perform one or more of the following operations: obtain electric logs (e.g., pipe inspection, caliper, gamma ray-neutron, differential temperature, noise, spinner flow survey, etc.) or install a bridge plug and pressure test the casing.
Options for the operator to resolve the breach may include partially replacing the production casing, installing a casing internal patch, cladding, or liner, and/or remedial cementing.
Preventive measures such as wellbore integrity inspections, mechanical integrity testing, and annular barrier monitoring and evaluations may identify potential direct cause failure mechanisms before they occur.
Downhole annular barrier breach. This leak path occurs when gas and/or hydrostatic pressure in the annulus exceeds the strength of the rock below the intermediate or surface casing shoe, resulting in establishment of an escape path outside the wellbore. Observations that a potential leak may exist are gas exiting somewhere beyond the structure of the wellbore.
In this case, storage gas finds a path of least resistance around the intermediate casing shoe and then into the subsurface lithology where it could enter an oil and gas, water, or abandoned well completed in a shallower permeable formation, or migrate all the way to an escape at the surface.
Diagnosing the failure mechanism requires the operator to obtain electric logs (e.g., gamma ray-neutron, differential temperature, ultrasonic/noise, etc.) as needed to determine the direct cause. In order to resolve this breach, the operators will usually require remedial cementing. Preventive measures such as wellbore integrity inspections, mechanical integrity testing, and annular barrier monitoring and evaluations may identify potential direct cause failure mechanisms before they occur.
B.4 Distribution
B.4.1 Distribution – Mains/Services
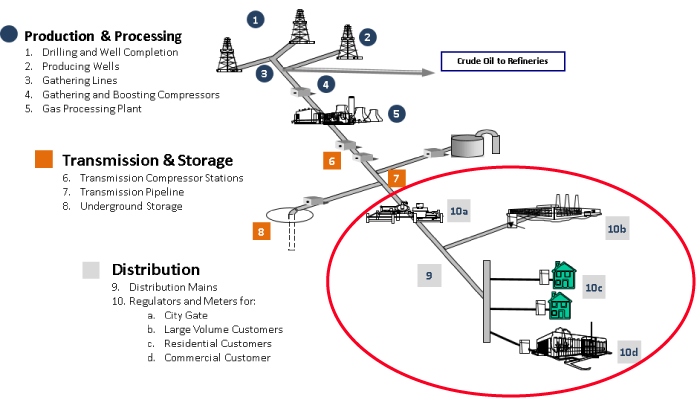
Figure 68. Distribution – mains/services.
Source: Adapted from the American Gas Association and EPA Natural Gas STAR Program
Table 27. Natural gas and petroleum system supply chain nomenclature in different programs – distribution – mains/services.
Source: Inventory of U.S. Greenhouse Gas Emissions and Sinks: 1990-2015 (USEPA 2017a).
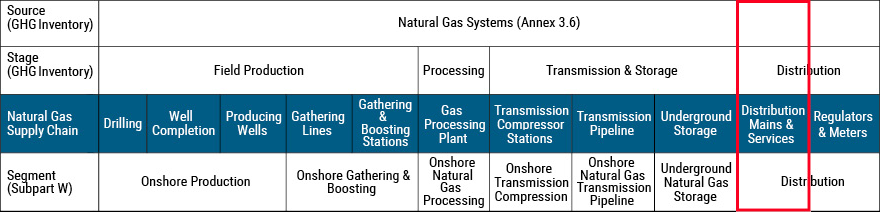
Distribution accounted for 6% of total emissions from all sources in the U.S. in 2014 according to the 2016 EPA GHGI (USEPA 2017a). Emissions are separated into those from transmission-distribution transfer stations (TDTS), metering/regulating stations, distribution mains, and services. Emissions from different types of mains are discussed including unprotected steel, protected steel, plastic, and cast iron. Also, we discuss three categories of end-user emissions including industrial, commercial, and residential. We include electricity production in industrial end-use for the distribution system.
B.4.2 Distribution – Regulators and meters
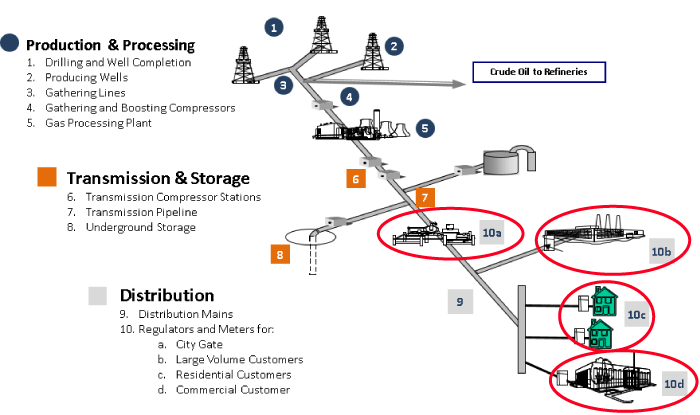
Figure 69. Distribution – regulators and meters
Source: Adapted from the American Gas Association and EPA Natural Gas STAR Program
Table 28. Natural gas and petroleum system supply chain nomenclature in different programs – distribution – regulators and meters.
Source: Inventory of U.S. Greenhouse Gas Emissions and Sinks: 1990-2015 (USEPA 2017a).
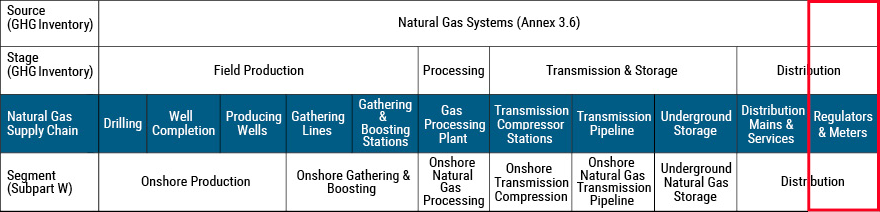
Table 29. 2015 Fugitive methane emissions from natural gas distribution – regulators and meters.
Source: Adapted from USEPA ANNEX 3.5, Methodology for Estimating CH4 and CO2 Emissions from Petroleum Systems (USEPA 2017a).
| Segment/ Source | Activity Data– Table 3.6-7: Activity Data for Natural Gas System Sources | Average CH4 Emission Factors– Table 3.6-2: Average CH4 Emission Factors (kg/ unit activity) for Natural Gas Systems and Sources | CH4 Emissions (kt/yr)– Table 3.6-1: CH4 Emissions (kt) for Natural Gas Systems, by Segment and Source |
| Pipeline Leaks | |||
| Mains – Cast Iron | 27,770 miles | 1157.3 kg/mile | 32.1 |
| Mains – Unprotected steel | 55,863 miles | 861.3 kg/mile | 48.1 |
| Mains – Protected steel | 484,749 miles | 96.7 kg/mile | 46.9 |
| Mains – Plastic | 706,594 miles | 28.8 kg/mile | 20.4 |
| Services – Unprotected steel | 3,297,457 services | 14.5 kg/service | 47.8 |
| Services – Protected steel | 14,330,139 services | 1.3 kg/service | 18.6 |
| Services – Plastic | 47,517,936 services | 0.3 kg/service | 12.5 |
| Services – Copper | 895,398 services | 4.9 kg/service | 4.4 |
| Meter/Regulator (City Gates) | |||
| M&R >300 | 4,026 stations | 2,142.7 kg/station | 8.6 |
| M&R 100-300 | 14,692 stations | 995.4 kg/station | 14.6 |
| M&R <100 | 7,853 stations | 727.2 kg/station | 5.7 |
| Reg >300 | 4,402 stations | 868.9 kg/station | 3.8 |
| R-Vault >300 | 4,328 stations | 50.6 kg/station | 0.2 |
| Reg 100-300 | 13,316 stations | 143.4 kg/station | 1.9 |
| R-Vault 100-300 | 12,060 stations | 50.6 kg/station | 0.6 |
| Reg 40-100 | 39,958 stations | 163.7 kg/station | 6.5 |
| R-Vault 40-100 | 8,144 stations | 50.6 kg/station | 0.4 |
| Reg <40 | 16,943 stations | 22.4 kg/station | 0.4 |
| Customer Meters | |||
| Residential | 53,339,363 outdoor meters | 1.5 kg/meter | 79.4 |
| Commercial/Industry | 5,611,121 meters | 9.7 kg/meter | 54.6 |
| Routine Maintenance | |||
| Pressure Relief Valve Releases | 1,274,976 mile main | 1 kg/mile | 1.2 |
| Pipeline Blowdown | 2,190,825 miles | 2 kg/mile | 4.3 |
| Upsets | |||
| Mishaps (Dig-ins) | 2190825 miles | 30.6 kg/mile | 67.1 |
B.5 Other
B.5.1 Abandoned Wells
Abandoned oil and gas wells are inactive wells that have been decommissioned due to economic reasons such as declining production. Many states require operators to plug the well bore of abandoned wells with cement to prevent fluid migration, but numerous wells remain unplugged because they were abandoned before regulatory requirements or orphaned by defunct operators. The number of abandoned wells is highly uncertain because of poor recordkeeping during early O&G development. (Brandt et al. 2014) reports a range of one to three million abandoned wells in the United States. In Pennsylvania, where wells were first drilled in the late 19th century, (Kang et al. 2016) estimates there are 450,000 – 700,000 abandoned wells in the state. Several recent studies have measured methane emissions from both plugged and unplugged abandoned wells. (Kang et al. 2016) directly measured emissions from 19 abandoned wells in Pennsylvania with a mean emission rate of 11 g CH4 h-1 well-1. In a follow-up study of 88 Pennsylvania wells, (Kang et al. 2016) reports that high emitting wells typically are unplugged gas wells or plugged wells in coal areas that vent coal seam gas for safety reasons. Additionally, high emitting wells were found to sustain their emission rates over two years of repeat measurements. (Townsend‐Small et al. 2016) measured emissions at 138 abandoned wells in the Denver-Julesburg (CO), Powder River (WY), Uintah (UT), and Appalachian (OH) basins. The mean emission rate was 1.4 g CH4 h-1 well-1, but individual rates were highly skewed: 93.5% of wells had non-detectable emission rates and the highest emitting well (146 g CH4 h-1) was responsible for over three-quarters of measured emissions. Plugging appeared to be highly effective at reducing emissions with only 1 of 119 plugged wells having detectable emissions (mean = 0.002 g CH4 h-1) compared to 8 of 9 unplugged wells (mean = 10 g CH4 h-1). Stable isotope measurements indicate that the source of emitted methane includes coal seams in addition to the targeted natural gas formation (Townsend‐Small et al. 2016).
Although methane emissions from abandoned wells usually are much lower than active wells, the large number of abandoned wells could lead to substantial emissions. (Townsend‐Small et al. 2016) estimate abandoned wells contribute 1.9 – 4.3% of O&G methane emissions; for Pennsylvania, they may be responsible for 5 – 8% of anthropogenic methane emissions (Kang et al. 2016). USEPA does not currently include estimates of abandoned well emissions in the U.S. GHGI, but they have requested feedback on activity data and emissions data that could be used to estimate emissions from this source in future inventories.
B.5.2 Non-Normal Distribution of Emissions: High Emitting Sources
A large and growing set of studies across the O&G supply chain shows that in any given source category, a small number of sources contribute a majority of the emissions. Several studies demonstrate that, at least in the areas studied, these unintentional, high-emitters are caused by abnormal process conditions (Zavala-Araiza et al. 2017). As a result, it has been argued that the official inventories described previously may underestimate the total volume of methane being emitted, and central estimates of emission rates (i.e., emission factors) may not capture the impact of the fat tail of skewed emissions distributions. However, a recent study in the Fayetteville Basin showed that at least in that basin, the higher atmospheric emissions measured at mid-day by aircraft reflected the timing of higher emissions from manual liquid unloadings taking place at the time of the overflights (Schwietzke et al. 2017).
Unusually high emitters, commonly called super emitters (Zavala-Araiza et al. 2017), can be infrequent; however, the impact of these few high emitting sources on total emissions volume is disproportionately large (Brandt et al. 2016). Across a variety of processes, operators, and regions, a small percentage of sites has been shown to account for a majority of emissions.
Emissions inventories are developed through extrapolating measurements made directly at emission sources to larger populations. The difficulty with this approach is obtaining a representative sample; extreme values can strongly influence average emissions, and very large statistically valid sample sizes are required to ensure these high emitters are sufficiently characterized. Table 30 below summarizes studies that discuss the discrepancies between atmospheric (top-down) measurements of methane emissions and bottom-up measurements; the former are typically much larger than the latter.
Over time, increasing amounts of data have been collected that cumulatively get closer to a representative sample of emissions. Direct measurement studies that have found a small percentage of leaks accounting for a majority of emissions are described in Table 31 below. Scientists have found these heavy-tailed distributions across different geographies, operators, and processes.
Table 30. Top-down vs. bottom-up measurement studies emissions from natural gas systems.
| Citation | Result |
| (Schwietzke et al. 2017), Improved Mechanistic Understanding of Natural Gas Methane Emissions from Spatially Resolved Aircraft Measurements, Environmental Science & Technology 51 (12):7286-7294. | Showed the higher atmospheric emissions measured at mid-day by aircraft reflected the timing of higher emissions from manual liquid unloadings taking place at the time of the overflights. |
| Miller, S. (2013). Anthropogenic emissions of methane in the United States. PNAS, 110 (50), 20018-20022. doi: 10.1073/pnas.1314392110 | Regional methane emissions due to fossil fuel extraction and processing could be 4.9 ± 2.6 times larger than in EDGAR |
| (Brandt et al. 2014). Methane leaks from North American natural gas systems. Science, 343 (6172), 733-735. doi: 10.1126/science.1247045 | National emission inventory underestimates methane emissions by 14 Tg/yr (0.73 trillion cubic feet of methane, with a range of 7–21 Tg/yr) |
| (Zavala-Araiza et al. 2015). Reconciling divergent estimates of oil and gas methane emissions. PNAS, 112 (51), 15597-15602. doi: 10.1073/pnas.1522126112 | Measured oil and gas methane emissions are 90% larger than estimates based on USEPA’s GHGI and correspond to 1.5% of natural gas production. This study found that methane emissions were 1.9 times the USEPA GHGI. |
| Pétron, G., et al. (2012), Hydrocarbon emissions characterization in the Colorado Front Range: A pilot study, J. Geophys. Res. Atmos., 117, D04304, doi:10.1029/2011JD016360 | Estimated that natural-gas producers in the D-J Basin (north of Denver) are losing from 2.3 to 7.7% of their gas to the atmosphere — not including additional losses in the pipeline and distribution system. The study suggests that methane emissions were three times the USEPA GHG emission inventory and VOC emissions two times the state inventory. |
| (Karion et al. 2013), Methane emissions estimate from airborne measurements over a western United States natural gas field, Geophys. Res. Lett., 40, 4393–4397, doi:10.1002/grl.50811 | Results from a 2012 field study in the Uinta Basin of Utah suggest an emission rate of methane leakage at 6.2 to 11.7% of the total production (8.9% +/- 2.7%). EPA GHGI equated to 1.42% in 2012. |
Table 31. High emitting source studies
| Citation | Segment | Sample Size | Result |
| Robertson, A., et al (2017) Variation in Methane 1 Emission Rates from Well Pads in Four Oil and Gas Basins with Contrasting Production Volumes and Compositions. Environ. Sci. Technol. 2017, DOI: 10.1021/acs.est.7b00571 | Oil & Gas Producing Wells | 160 wellpads | 51/16/30 wellpads in Upper Green River/DJ/Uinta … 20% wellpads contributed ~72-83% of emissions
53 wellpads in Fayetteville … 20% wellpads contributed ~54% of emissions |
| Brandt, A. (2016). Methane leaks from natural gas systems follow extreme distributions. Environ. Sci. Technol., 50 (22), 12512–12520. doi: 10.1021/acs.est.6b04303 | All | 15,000 previous measurements | Aggregated 15,000 measurements from 18 prior studies, finding that 5% of leaks contribute over 50% of total leakage volume. |
| Zavala-Araiza, D., Alvarez, R. A., Lyon, D. R., Allen, D. T., Marchese, A. J., Zimmerle, D. J., & Hamburg, S. P. (2017). Super-emitters in natural gas infrastructure are caused by abnormal process conditions. Nature communications, 8, 14012. | Gas Producing Wells | 17,000 wellpads | Highest emitting 1% and 10% of sites accounted for roughly 44% and 80% of total CH4 production emissions from ~17,000 production sites |
| Frankenberg, C. (2016). Airborne methane remote measurements reveal heavytail flux distribution in Four Corners region. PNAS, 113 (35), 9734–9739. doi: 10.1073/pnas.1605617113. | Gas Producing Wells, Gas Processing Plants, Gas Gathering Lines, Gas Transmission Pipelines | 250 point sources | 10% of emitters accounted for ~50% of observed point source emissions, roughly ~25% of total basin emissions. |
| Lyon, D. (2016). Aerial Surveys of Elevated Hydrocarbon Emissions from Oil and Gas Production Sites. Environ. Sci. Technol., 50 (9), 4877–4886. doi: 10.1021/acs.est.6b00705 | Oil and Gas Producing Wells | 8,000 well pads | Of 8,000 well pads, 4% of sites had high-emitting sources (detection threshold was 1-3 g/s). |
| Schade, G., Roest, G. (2016) Analysis of non-methane hydrocarbon data from a monitoring station affected by oil and gas development in the Eagle Ford shale, Texas. Elementa, DOI: 10.12952/journal.elemnta.000096 | Gas Producing Wells | Eagle Ford Region – “routine” ethane 4-5 X background; “upsets” ethane ~100 X background | |
| Hendrick, M. (2016). Fugitive methane emissions from leak-prone natural gas distribution infrastructure in urban environments. Environmental Pollution, 213, 710-716. doi: 10.1016/j.envpol.2016.01.094 | Distribution Mains | 100 natural gas leaks from cast iron distribution main | 7% of leaks contributed 50% of emissions measured. |
| Omara, M. (2016). Methane Emissions from Conventional and Unconventional Natural Gas Production Sites in the Marcellus Shale Basin. Environ. Sci. Technol., 50 (4), 2099-2107. doi: 10.1021/acs.est.5b05503 | Gas Producing Wells | 35 well pads | Of 13 unconventional routinely operating well pads, 23% of sites accounted for ~85% of emissions; of 17 conventional well pads, 17% of sites accounted for ~50% of emissions. |
| Zavala-Araiza, D. (2015). Reconciling Divergent Estimates of Oil & Gas Methane Emissions. PNAS, 112 (51), 15597–15602. doi: 10.1073/pnas.1522126112 | Gas Producing Wells, Gas Processing Plants, Gas Transmission Compressor Stations | 413 sites | 2% of facilities are responsible for 50% of the emissions, 10% of facilities are responsible for 90% of the emissions. |
| Zimmerle, D. (2015). Methane Emissions from the Natural Gas Transmission and Storage System in the United States. Environ. Sci. Technol., 49 (15), 9374–9383. doi: 10.1021/acs.est.5b01669 | Gas Transmission Compressor Stations, Gas Underground Storage | new measurements from 677 facilities, activity data from 922 facilities | Authors note that “equipment-level emissions data are highly skewed” |
| Lamb, B. (2015). Direct Measurements Show Decreasing Methane Emissions from Natural Gas Local Distribution Systems in the United States. Environ. Sci. Technol., 49 (8), 5161–5169. doi: 10.1021/es505116p | Distribution Mains/Services, Regulators & Meters | 257 pipe leakage measurements, 693 metering and regulator measurements | 3 large leaks accounted for 50% of total measured emissions from pipeline leaks |
| (Rella et al. 2015). Measuring emissions from oil and natural gas producing well pads in the Barnett Shale region using the novel mobile flux plane technique. Environ. Sci. Technol., 49 (7), 4742– 4748. doi: 10.1021/acs.est.5b00099 | Oil and Gas Producing Wells | 182 well pads | ~6% of sites accounted for 50% of emissions, 22% of sites accounted for 80% of emissions |
| Yacovitch, T. (2015). Mobile Laboratory Observations of Methane Emissions in the Barnett Shale Region. Environ. Sci. Technol., 49 (13), 7889-7895. doi: 10.1021/es506352j | Oil and Gas Producing Wells, Gas Gathering & Boosting Compressor Stations, Gas Transmission Compressor Stations, Gas Processing Plants | 188 emission measurements | 7.5% of emitters contributed to 60% of emissions |
| Marchese, A.J., et al (2015) Methane Emissions from United States Natural Gas Gathering and Processing.
Environ. Sci. Technol., 2015, 49 (17), pp 10718–10727. DOI: 10.1021/acs.est.5b02275. |
Gas Gathering & Boosting Compressor Stations | 114 compressor stations | 25 CSs vented >1% of gas processed, 4 CSs vented >10% gas processed |
| Mitchell, A. (2015). Measurements of Methane Emissions from Natural Gas Gathering Facilities and Processing Plants: Measurement Results. Environ. Sci. Technol., 49 (5), 3219–3227. doi: 10.1021/es5052809 | Gas Gathering & Boosting Compressors, Gas Processing Plants | 114 gathering facilities, 16 processing plants | Of 114 compressor stations, 30% of sites were responsible for ~80% of emissions; of 16 gas processing plants, 45% of sites were responsible for ~80% of emissions. |
| Subramanian, R. (2015). Methane Emissions from Natural Gas Compressor Stations in the Transmission and Storage Sector: Measurements and Comparisons with the EPA Greenhouse Gas Reporting Program Protocol. Environ. Sci. Technol., 49 (5), 3252–3261. doi: 10.1021/es5060258 | Gas Transmission Compressor Stations | 47 compressor stations | Of 45 compressor stations, 10% of sites accounted for ~50% of emissions. |
| Kang, M. (2014). Direct measurements of methane emissions from abandoned oil and gas wells in Pennsylvania. PNAS, 111 (51), 18173–18177. doi: 10.1073/pnas.1408315111 | Abandoned Wells | 19 abandoned wells | Of 19 abandoned wells, 3 had flow rates 3x larger than the median flow rate. |
| Allen, D. (2014). Methane Emissions from Process Equipment at Natural Gas Production Sites: Pneumatic Controllers. Environ. Sci. Technol., 49 (1), 633-640. doi: 10.1021/es5040156 | Gas Producing Wells | 377 pneumatic controllers | 20% of devices accounted for 96% of emissions. |
| Allen, D. (2014). Methane Emissions from Process Equipment at Natural Gas Production Sites: Liquids Unloadings. Environ. Sci. Technol., 49 (1), 641-658. doi: 10.1021/es5040156r | Gas Producing Wells | 107 wells with liquids unloading | Without plunger lift, 20% of wells accounted for 83% of emissions; with plunger lift and manual, 20% of wells accounted for 65% of emissions; with plunger lift and automatic, 20% of wells accounted for 72% of emissions. |
B.5.3 Offshore Facilities
Table 32. 2015 Fugitive methane emissions from natural gas production – offshore facilities.
Source: Adapted from USEPA ANNEX 3.5, Methodology for Estimating CH4 and CO2 Emissions from Petroleum Systems (USEPA 2017a).
| Segment/ Source | Activity Data- Table 3.6-7: Activity Data for Natural Gas System Sources | Average CH4 Emission Factors- Table 3.6-2: Average CH4 Emission Factors (kg/ unit activity) for Natural Gas Systems and Sources | CH4 Emissions (kt/yr)- Table 3.6-1: CH4 Emissions (kt) for Natural Gas Systems, by Segment and Source |
| Vented Emissions | |||
| OCS Offshore Platforms, shallow water oil, fugitive vented, and combusted | 1,447 No. of shallow water oil platforms | 116,358.9 kg/platform | 168.3 |
| OCS Offshore Platforms, deep water oil, fugitive, vented, and combusted | 29 No. of deepwater oil platforms | 659,657.7 kg/platform | 19.3 |
While this effort does not include offshore facilities within its scope, there is need for further analysis and research into the offshore subsector. There are programs and resources currently available to begin this effort, for example the Gulfwide Offshore Activity Data System program (GOADS) is a study conducted by the Bureau of Ocean Energy Management Enforcement (BOEM). This study is set up to comply with 30 CFR 550.302-304 which requires that petroleum and natural gas production platforms located in the Federal Gulf of Mexico to report their activities to BOEM once every three to four years. The activities reported include:
- Emissions sources
- Volumes of throughputs from some equipment
- Fuel consumption by combustion devices
- Parametric data from some emission sources like glycol dehydrators
While this requirement does not apply to all U.S. offshore oil and natural gas operations, it may be assessed and evaluated for strengths and opportunities. This ITRC team recommends that a future project include offshore O&G operations equipment inventory and emissions analysis.
Publication Date: September 28, 2018

