2 Characterization of Emissions
2.1 Introduction
Methane is a component of emissions from a variety of sources all along the natural gas and petroleum systems. Along with methane, the system typically contains other components like volatile organic compounds (VOCs) and hazardous air pollutants (HAPs) like benzene. Moving downstream from wells to natural gas end users, the VOCs and HAPs generally decrease while methane fraction increases to about 95%. The U.S. Environmental Protection Agency (USEPA) tracks methane emissions from the natural gas and petroleum systems in their annual Greenhouse Gas (GHG) Inventory (USEPA 2017a) and oil and gas companies report their methane and carbon dioxide emissions through the EPA Greenhouse Gas Reporting Program – Subpart W. USEPA estimates that natural gas and petroleum systems account for 31% of anthropogenic methane emissions in the U.S. (USEPA 2017a). In this section, we introduce the reader to the natural gas and petroleum system supply chain and we briefly describe the various sources of methane. Further details and emission data is provided in Appendix B – Characterization Additional Materials.
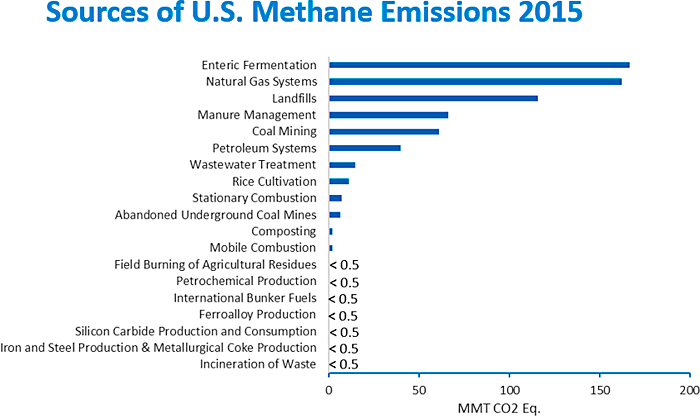
Figure 1. USEPA Greenhouse Gas Inventory Reporting Year 2015 – Natural Gas and Petroleum Systems Annex 3 (MMT CO2 eq = million metric tons of CO2 equivalents).
Source: Courtesy of the American Gas Association.
Figure 2 is used in USEPA and other industry sources to orient the reader to the natural gas and petroleum system supply chain. This document will generally follow this supply chain. Click on any number to find more information on this segment in Appendix B.
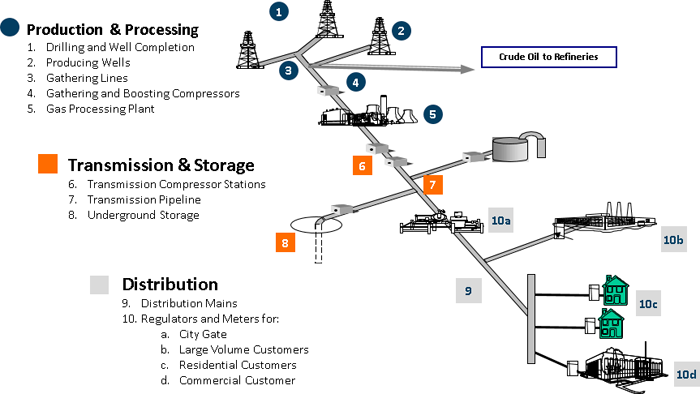
Figure 2. Schematic of the natural gas and petroleum system supply chain.
Source: Adapted from the American Gas Association and EPA Natural Gas STAR Program.
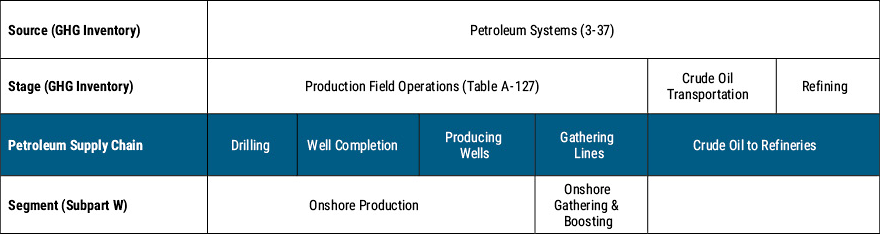
Nomenclature used to describe the supply chain in natural gas and petroleum systems varies. The organization provided in this section will be described first as compared to the USEPA Greenhouse Gas Inventory and the USEPA Greenhouse Reporting Program – Subpart W (GHGRP-Subpart W). Tables 1 and 2 show where each process falls into each of the systems of organization. This document uses the highlighted nomenclature.
Table 1. Comparison of natural gas system characterization of Subpart W, GHG Inventory and this assessment.
Source: USEPA.
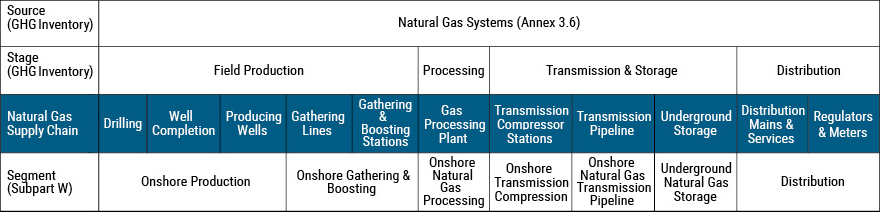
Table 2. Comparison of petroleum system characterization of Subpart W, GHG Inventory and this assessment.
Source: USEPA.
The quantity and composition of those emissions can vary significantly between each of the supply chain segments and even within the same segment. The key factors that affect the amount of emissions from a given operation are the availability of infrastructure, how well-maintained the system is, the amount of waste gas created, and the incentives or regulatory requirements to control waste-gas volumes or to reduce fugitive emissions.
The composition of the gases emitted to the atmosphere through the natural gas and petroleum supply chains varies by field from the geophysical and geochemical reservoir conditions in the production segment, by equipment sources within a segment (processing/treatment requirements, design and operating practices), and by segments successively downstream as the gas stream is processed and impurities removed.
Within the production segment, emission composition varies by the particular process within the segment. For example, the gas supply for pneumatic devices is from the separator gas so it has a higher percentage of methane and a lower percentage of VOCs than the gaseous emissions from liquid hydrocarbon storage tanks. Even the emission composition from hydrocarbon storage tanks varies considerably depending on, among other process parameters, the composition of the pressurized liquid entering the tank. If there was a stuck open dump valve that unintentionally carried through gas from the separator, the emission stream from the storage tank would be higher in methane than routine flashing and working/standing/breathing emissions.
Typically, production and processing activities tend to have greater amounts of fugitive emissions as a percentage of throughput than downstream activities (IPCC 2006).
Transmission pipeline gas is almost entirely methane, since end-use processes and equipment require such fuel for safe and reliable operation. See the Appendix B for more details.
Some of these emission sources may be regulated and others not. For example, some but not all states have regulations requiring emission reductions from storage tanks depending upon the potential emissions from that equipment. States could have differing thresholds where emission reductions would be required. A federal regulation also covers storage tanks constructed since August 2011 that emit over six tons of VOCs per year. See the Regulatory Section for more details.
The sources of fugitive emissions on oil and gas systems include, but are not limited to, equipment leaks, evaporation and flashing losses, venting, flaring, incineration, and accidental releases. While some of these emission sources are engineered or intentional, and therefore relatively well characterized, the quantity and composition of the emissions is generally subject to significant uncertainty (IPCC 2006). For further complexity, some of these emission sources are continuous and others are intermittent.
Examples of intentional, engineered emission releases include:
- Venting or flaring of continuous process waste streams (e.g., tank emissions, glycol dehydrator regenerator emissions)
- Storage losses (Flashing, working, and breathing losses)
- Fuel combustion
- Incinerators
- Equipment depressurization and blowdown for maintenance
- Use of natural gas as the supply medium for pneumatic devices
Examples of non-routine engineered emission releases include:
- Emergency pressure relief
- Fugitive equipment leaks
- Leakage into vent and flare systems
- Emissions from engine crankcase vents
- Venting and flaring due to power outages and process upsets
Examples of non-engineered emission releases include:
- Unintentional gas carry-through to storage tanks (e.g., leakage past the seats of drain and dump valves, malfunctioning level controllers, set-point of the liquid-level controller on a separator or scrubber is too low, inefficient upstream gas/liquid separation)
- Venting from blowdown vents (when maintenance is not occurring due to leaking valve)
- Spills and accidental releases (e.g., well blowouts, pipeline breaks, tank explosions, gas migration to the surface around the outside of wells, and surface-casing vent blows)
- Incomplete combustion, unburned hydrocarbons (beyond that which is anticipated in design) (e.g., engines, heaters, heat exchangers, flares, combustors)
- Deteriorated performance due to wear or malfunctioning of components (e.g., leakage past pistons in engines)
- Inefficient loading (e.g., oversized engines, poor air-fuel ratio tuning)
- Fouling problems
- Use of old or outdated technologies
- Abnormal process or improperly operated
- Operator error (e.g., manual drain valve left partially open)
- Gas migration to the surface around the outside of the well casing
- Underground pipeline leaks
- Surface casing vent blows
- Improperly sized, maintained, or functioning emission control systems
- Vapor collection systems
- Catalytic converters
- Flame failures
The very breadth of processes required for the natural gas and oil supply chain demonstrates the need for varied leak detection technologies. Leak sources contain different compositions, frequencies, and flowrates requiring the selection of appropriate leak detection technology.
Publication Date: September 28, 2018

