Appendix A – Case Studies Summaries and Links
Summaries of published case studies are provided in this guidance document for comparative analysis of actual methane detection technologies as well as implementation methodologies. Case studies presented were selected based on their relevance to the development of a comparison methodology for emissions detection technologies.
The summaries provide overviews of current and ongoing studies in this evolving field. Case studies offer details and data with regard to the application, design, performance, and monitoring of technologies or approaches as described in Sections 4 and/or 5 of this document (Technology and Evaluation Guidelines and Principles, respectively). Although Sections 4 and 5 have the most direct relation to these case studies, specific studies also relate to and support other sections of this guidance document.
Each summary provides a description of the case study including; background, technologies, assessment and study conclusions. The amount of information provided in each published case study varied based in part on the focus, purpose and/or goals of each. Consequently, the level of detail provided in each summary presented in this guidance generally reflects the amount of information that was available for review. Links to the actual case studies are provided in each summary to enable the reader to review and gather additional details.
The table below lists the twenty-five (25) case studies summarized in this document followed by the individual case study summaries:
Table 6. Case studies summaries table
Source: ITRC Methane Team.
A.1. Optical Gas Imaging at Jonah Energy
Author(s): FLIR Systems Application Note, Jonah Energy
Date: April 2016
Industry Sector: Oil & Gas (O&G)
Technology or Methodology Utilized: OGI
Case Study Link: http://www.flirmedia.com/MMC/THG/Brochures/OGI_014/OGI_014_US.pdf
1.0 Background
Methane, an extremely potent greenhouse gas, and other volatile organic compounds (VOCs) are often emitted during industrial operations in the O&G industry. OGI is a recent technique that can potentially be used in place of toxic vapor analyzers (TVAs) (the current USEPA leak-detection standard). The objective of this case study was to show how OGI technology has the potential to save gas and money based on the results of a study conducted by Jonah Energy. There are numerous OGI studies, but very few with cost justification of the technology. The study was centered on the potential effectiveness of OGI at Jonah Energy in Sublette County, WY.
2.0 Technology Utilized
Methane and VOCs absorb certain wavelengths of infrared radiation. The OGI camera used by Jonah Energy uses infrared (IR) to see methane and VOCs by searching for “shadows” that stick out from the background caused by the gases absorbing radiation. It works real-time, can scan wide swaths at a time, and is reportedly nine times faster than Method 21 protocol (City of Fort Worth Natural Gas Air Quality Study).
3.0 Assessment
OGI’s speed offers the potential for more frequent inspections which may result in preventing greater leakage, consequently allowing for reduction of methane and VOC emissions. During the span of the five-year study, Jonah’s Enhanced Direct Inspection and Maintenance (EDIM) has reduced fugitive emissions by 75% (see summary graph Figure 43 below). It also reduced repair time by over 70%, cut labor costs in half, and reduced emissions in tons by over 80%.
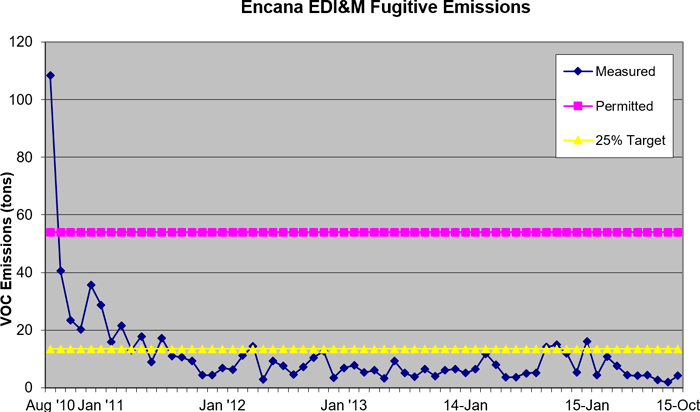
Figure 43. OIG reduced fugitive emissions.
Source: Provided by FLIR.
4.0 Case Study Conclusions
Fast identification of leaks leads to quicker repairs, minimizing environmental detriment while cutting asset losses. It was found that the total savings exceeded the costs of monitoring and repair by over five times when you take the cumulative gas savings during the span of the study.
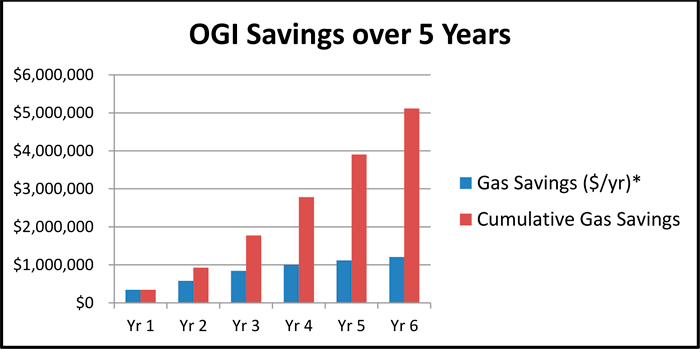
Figure 44. Gas savings proposed by Johan Energy for five years of OGI LDAR Program.
Source: Provided by FLIR.
A.2 Are Optical as Imaging Technologies Effective for Methane Leak Detection?
Author(s): Arvind P. Ravikumar, Jingfan Wang, and Adam R. Brandt (Ravikumar et al. 2017)
Date: November 29, 2016
Industry Sector: O&G
Technology or Methodology Utilized: Open Source Model
Case Study Link: https://pubs.acs.org/doi/abs/10.1021/acs.est.6b03906
1.0 Background
The USEPA proposed regulations requiring the use of OGI technologies to identify and repair leaks. Regional studies made from aircraft find emission rates that do not align with expected emissions rates, which indicates emissions may be higher than previously thought. The most common OGI technology used in the O&G industry for methane relies on IR imaging. Many facilities utilize OGI-based technology for leak detection; however, systematic scientific analysis of the performance is lacking. The objective of this case study is to provide an analysis of OGI technology performance.
2.0 Technology Utilized
The study focused on the development and testing of a predictive model to more accurately simulate passive IR imaging. The technology was used to address the potential effectiveness of IR leak detection.
3.0 Assessment
The predictive model is used to evaluate OGI technology by varying parameters such as temperature and wind conditions, imaging distance and detection criterion, and facility characteristics. The combined model results and experimental data provide recommendations and best practices for achieving methane detection accuracy.
4.0 Case Study Conclusions
The predictive model found that imaging distance is the most important parameter for effective leak detection. The resolution is inversely proportional to the square of the imaging distance that results in a progressive reduction in efficiency. Measuring against the sky led to an increase in resolution due to a greater difference in temperature change. Warmer days increase resolution due to a more significant difference between plume temperature and surrounding equipment. The minimum detection threshold can be up to 3-4 times lower for wet-gas compared to dry-gas compositions. Wet-gas contains hydrocarbons with lower minimum detection limit which may skew greenhouse gas (GHG) emissions data.
A.3 Monte Carlo Simulation Evaluation of Gas Imaging Technology
Author(s): David Epperson
Date: October 23, 2000
Industry Sector: O&G
Technology or Methodology Utilized: OGI and EPA Monte Carlo Software
Case Study Link: https://www.regulations.gov/document?D=EPA-HQ-OAR-2003-0199-0025
1.0 Background
The primary objective of the study was to identify the level of performance at different monitoring frequencies that are necessary for gas imaging or similar technology to provide equivalent environmental protection to quarterly monitoring. The secondary objective was to identify the potential performance of gas imaging technology. Using USEPA Monte Carlo Software, a simulation is generated that model 500, 1,000, and 10,000 ppmv. The characteristics of the site are a steady state with a constant mass.
2.0 Technology Utilized
The technology used to evaluate gas imaging technology is USEPA Monte Carlo Software. The Monte Carlo Software was selected because the model is utilized under current work practices and compares alternative work practices.
3.0 Assessment
The study utilized ten (10) specified assumptions to modify the USEPA Monte Carlo Software model for simulating gas imaging technology.
The cost of the simulation technology varies based on the study size. USEPA has approved the current protocol and the Monte Carlo Software is currently being utilized. Alternatives to the software are newer models with a graphic interface, maximum likelihood estimation models, or Bayesian Statistical Modeling.
4.0 Case Study Conclusions
Mass emission rate for a given alternative work practice monitoring frequency and Method 21 was precise. Both alternative and current work practices were equivalent in determining leaks at the same monitoring frequency and identified all of the largest simulated mass emissions rates. Alternative work practice modeling did not identify leaks below the leak definition being tested. The study using the software indicated gas imaging technology is a relatively accurate and effective technology.
A.4 Quantifying Cost-effectiveness of Systematic Leak Detection and Repair Programs Using Infrared Cameras
Author(s): Carbon Limits AS (Limits 2014)
Date: March 2014
Industry Sector: Oil Production and Natural Gas
Technology or Methodology Utilized: OGI Camera
Case Study Link: http://www.catf.us/resources/publications/files/Carbon_Limits_LDAR.pdf
1.0 Background
This case study used data from two (2) LDAR contractors using IR cameras to detect sources of natural gas leaks and venting at well sites, compressor stations, and gas plants. Ninety (90) percent of the monitoring was done in Canada at facilities with established LDAR monitoring programs. The remaining monitoring was performed in the United States. The monitoring results were then used to determine the economic merits of a LDAR program using IR cameras.
The following table provides general background information for this case study.
| Sector: | Oil and Gas Sector |
| Facility Type: | Compressor Stations, Gas Plants, and Well Sites / Batteries |
| Acres: | N/A |
| Volume: | 1,915 compressor stations, 614 gas plants and 1,764 well sites/well batteries |
| Participating Parties: | Anonymous facilities |
| Description: | Quantifying cost-effectiveness of systematic LDAR Programs using IR cameras |
| Site Complexities: | |
| Other Pollutants: | Methane and VOCs |
| Characteristics: | This study used assumed gas compositions. For example: sweet gas contains 79% methane with 7.5% VOCs and sour gas contains 71% methane with 3.6% VOCs. |
| Other: | Facility specific information such as age, size, operating mode, etc. was not available for this study. |
2.0 Technology Utilized
IR cameras were used in order to detect leaks and venting from a range of natural gas facilities.
3.0 Assessment
Gas plants have the highest leak rate. Thirty-six (36) percent of well sites and batteries surveyed have no leaks at all. OGI inspection frequency (monthly, quarterly, semi-annually, annually) affects the leak rates. More frequent OGI surveys results in lower leak rates, but higher costs.
Limitations of the study are that 90% of the data in this report is from Canada with established LDAR monitoring of facilities. It is not representative of U.S. facilities. This study expects higher leak rates in general from U.S. facilities (the study indicates only newer facilities in the U.S. require LDAR), which would result in higher abatement costs. A way to overcome the lack of a data set more relevant to the U.S. would be to include a representative number of U.S. facilities in future investigations.
The overall cost assumes recovered gas costs $4/Mcf. Based off this assumption, OGI contractors charge approximately $600 to $1,800 per survey at well sites and over $5,000 per survey at a typical gas plant. The highest abatement cost is $3,400/TVOC at compressor stations using monthly OGI surveys. The cost decreases to $700/TVOC using quarterly OGI surveys and decreases to $200/TVOC using an annual OGI survey. Assuming a negative abatement cost, this would provide a consequent benefit for facility owners.
4.0 Case Study Conclusions
This study suggests that it is more economical to repair all leaks instead of picking and choosing which ones to repair. The study states O&G sector methane emissions are approximately 3% of the total U.S. greenhouse gas emissions and approximately 30% of the methane emissions are leaks from the O&G sector. However, the leak rates in this study are not specifically representative of U.S. facilities since most of the leak detection data set utilized was from Canadian facilities.
Leak rates increased from 2% to 10% at gas plants by conducting monitoring annually instead of monthly. Gas plants represent facilities with the highest leak rate. Thirty-six (36) percent of well sites and batteries have more modest leaks as compared to gas plants and reportedly, approximately one-third have no detected leaks. Compressor rod packing venting represents 21% of the total emissions observed at gas plants and 17% at compressor stations. The monitoring data in this study included 2,160 compressors with measured emission rates. The mean rod packing vent rate is 56.7 SCFH with a large portion originating from a relatively small fraction of compressors; 50 percent of emissions are from 7% of the compressors emitting more than 200 SCFH. Replacing rod packing has a small effect on the overall abatement cost of an LDAR survey program.
A.5 Concawe Report no. 2/17: An Evaluation of an Optical Gas Imaging System for the Quantification of Fugitive Hydrocarbon Emissions
Author(s): Concawe Air Quality OGI Ad-Hoc Group (Optical Gas Imaging): C. Caico, L. Fragu, L. Gonzalez, C. Juéry, P. Kangas, C. Lawson, J. Negroni, P. Roberts, B. Smithers, P. Tupper, and K. Vaskinen
Date: January 2017
Industry Sector: O&G
Technology or Methodology Utilized: TVA and Thermal Imaging IR Camera with an add-on device to quantify leakage rates
Case Study Link: https://www.concawe.eu/wp-content/uploads/2017/01/rpt_17-2.pdf
1.0 Background
Test the performance of a quantitative optical gas imaging (QOGI) system to measure the mass emission rate of hydrocarbon leaks from industrial process equipment. For comparison purposes, a conventional sniffing technique was also used for leak detection with emission estimates determined using the correlation equations from Method 21.
The following table provides general background information for this case study.
| Sector: | Oil and Gas |
| Facility Type: | VITO’s leak detection and repair facility in Mol, Belgium |
| Acres: | N/A |
| Volume: | 61 leak tests performed |
| Participating Party: | Concawe |
| Description: | Leaking components were flange, valve, open-ended pipe |
| Site Complexities: | |
| Other Pollutants: | Tested pollutant was a mixture of methane, propane, propylene (~33% each) |
| Characteristics: | Leak Rate was 1.7 – 1000 g/h |
| Other: | Camera distance was 2, 3, 5, and 10 meters from the source |
2.0 Technology Utilized
OGI allows hydrocarbon leaks to be visualized with add-on modules working with the OGI camera to calculate the hydrocarbon emission rate. A Method 21-approved sniffer was used to estimate the emission of the leaking components as approved by Method 21.
3.0 Assessment
Where leak rate quantification was achieved with the QOGI system, the differences between the values determined and the known release rates were within a range of -23% to 69%, with an average difference of 6%. By comparison, where the Method 21 correlations were used to estimate leak rates, these differed from the known release rates within a range of -92% to 667%, with an average difference of 31%. During this evaluation, 24 tests were undertaken and seven release rates were used during the campaign: 1.7, 10. 16.5, 50, 175, 200 and 1,000 g/h. The figure below provides the average values for the Method 21 and QOGI calculated emission rates for the tests at each of the flow rates.
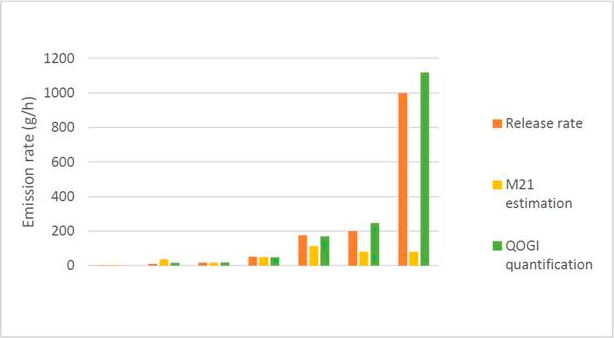
Figure 45. Comparison of emission rates determined by M21 and QOGI for each of the set release rates (1.7, 10, 16.5, 50, 175, 200 and 1,000 g/h).
Source: Provided by Concawe Report, no. 2/17.
The OGI camera requires a temperature difference between the gas and the background for detection. From these tests, it was found that the current technology required a temperature difference of 5°C in order to successfully quantify emissions.
4.0 Case Study Conclusions
This study was unique in a developing technology (QOGI) and comparing it to the proven Method 21 quantification technology. The results favor the newer technology, but this study was performed in a controlled environment and not in field conditions.
OGI was effective as a visual tool but was limited to detection only and not quantification. The QOGI system was able to provide accurate quantification for individual leaks over the range of 1.7 to 1,000 g/h. Even where estimation is made for the total emissions from a number of leak sources (for example as would occur in an LDAR survey), the QOGI system provided a more accurate total flux value than Method 21. This suggests that QOGI has the potential to be used for numerous applications in the O&G industry, including demonstration of LDAR compliance. These results were achieved when using a temperature differential between the gas plume and background of 5°C.
Method 21 correlations cannot be used to accurately estimate individual leak rates because of the statistical method used in their development.
A.6 City of Fort Worth Natural Gas Air Quality Study Final Report
Author(s): Eastern Research Group and Sage Environmental Consulting, LP
Date: July 13, 2011
Industry Sector: Natural Gas Production and Processing Sites
Technology or Methodology Utilized: OGI IR Cameras and Method 21: TVA plus High Volume Dilution Sampler and Summa Passivated Stainless Steel Canisters
Case Study Link: http://fortworthtexas.gov/uploadedFiles/Gas_Wells/AirQualityStudy_final.pdf
1.0 Background
The purpose of the study was to review air quality issues associated with natural gas exploration and production. The study was performed with both Method 21 and the alternative work plan (AWP) of Method 21 allowing OGI in lieu of TVAs with the exception that the TVA must be used once per year. With this current limited use of OGI in place of Method 21, there are some states that are considering the use of OGI solely as their Uniform Standard (e.g., Colorado) and in place of Method 21. There is also a summary white paper on this study from David Ranum of Sage Environmental Consulting, LP that was presented at InfraMation in 2015 titled: Optical Gas Imaging Versus Method 21.
The following table provides general background information for this case study.
| Sector: | Natural Gas Midstream, Production, and Processing Sites in Fort Worth, TX |
| Facility Type: | 375 natural gas well pads, 8 compressor stations, a gas processing plant, and a saltwater treatment facility |
| Acres: | N/A |
| Volume: | Average Point Source Emission Volumes by Site Type as measured by a high volume dilution sampler Site Type / TOC (cubic feet/year) Well Pad / 148,552 Well Pad with Compressor(s) / 218,035 Compressor Station / 188,236 Processing Facility / 372,019 Saltwater Treatment Facility / 526 |
| Study Participants: | Owners of the 388 Sites in Fort Worth: Burnett Oil Production 2 Chesapeake Operating Inc. Crosstex Crow Creek Operating Inc Devon Energy Production Co Eagle Oil and Gas Encana Oil & Gas (USA) Inc Finley Frost Brothers Grand Operating Inc Lakota Energy LTD Newark Energy Proven Resources Quicksilver Resources Range Production Co Vargus Energy LTD Williams Production XTO Energy Inc |
| Description: | Well pads, compressor stations, processing facilities, a salt water treatment facility, drilling operations, fracking operations, and completion operations. |
| Site Complexities: | |
| Other Pollutants: | There were numerous other pollutants that are monitored under Method 21 as this study was one of the technologies associated with Method 21. |
| Characteristics: | Methane was the primary air pollutant emitted at all sites which constitutes over 94% of the TOC (total organic compound) estimate for all sites combined. Some key pollutants other than methane in the study include: Acetaldehyde, Benzene, 1,3-Butadiene, Carbon tetrachloride, p-Dichlorobenzene, Formaldehyde, and Tetrachloroethylene |
| Other: | Methane had the highest concentrations of the study analytes. |
2.0 Technology Utilized
OGI is the AWP for Method 21 whereas a TVA is the current approved device for Method 21. The high volume dilution sampler testing was conducted at all emission points identified with the IR camera (high level emissions) as well as at each emission point identified through Method 21 screening with a concentration greater than 500 ppmv (low level emissions).
3.0 Assessment
The number of leaks detected by Method 21 but not detected by OGI represents 38% of the total leaks (797/2,094) but only 8% of the total emissions (100% – 92%).
The OGI camera had limitations in detecting smaller leaks but was successful in finding most leaks at a faster rate. The TVA was more successful in detecting smaller leaks but is much more time consuming in utilization. The TVA is more cost sensitive than OGI cameras.
4.0 Case Study Conclusions
The Fort Worth Study was a comprehensive Air Pollution Study with significant data secured. In the study, methane was the primary air pollutant emitted at all sites which constitutes over 94% of the TOC estimate for all sites combined. The referenced white paper from the surveying company provides more details relating to the various technologies used in the study by comparing OGI to Method 21.
OGI can be more efficient at component leak detection inspection (OGI surveyed 100% of the equipment while Method 21 surveyed only 11% in the same time).
When using a TVA, Method 21 inspections were more effective at finding all leaks including the low leak definitions of the current regulations.
The high volume dilution sampler was effective in quantifying the leaks found by both the OGI and Method 21 technologies.
A.7 Comparing Policies to Reduce Methane Emissions in the Natural Gas Sector
Author(s): Clayton Munnings and Alan Krupnick, (Munnings and Krupnick 2017)
Date of Article: July 2017
Industry Sector: All Oil and Natural Gas Subsectors
Technology or Methodology Utilized: Policy for evaluating the monitoring and reporting of methane gas emissions in the natural gas sector.
Case Study Link: http://www.rff.org/files/document/file/RFF-Rpt-Methane.pdf
1.0 Background
The study indicates that methane emissions from the natural gas sector have the potential to reduce beneficial gains of the use of gas over coal due to the unregulated methane emissions policies or the poor economic decisions of imposing one solution over all sites with methane leaks. The majority of existing sources of methane emissions in the natural gas sector remain unregulated. This is due in part to concerns that policies to mitigate these emissions would entail overseeing a large number of sources and impose significant administrative and compliance costs.
Nine findings are identified in the study, some of which have implications for general methane emission monitoring, leak repair, and reporting policy design, while others can be used to compare and contrast policies for updated methane emission monitoring, leak repair, and reporting. The most significant findings include: accurate emission inventories are not currently available, each natural gas subsector accounts for significant emissions, there are wide heterogeneities in abatement costs across subsectors and technologies and a small number of units or categories of equipment termed “super-emitters” account for the majority of leaked methane: USEPA’s best management practices for LDAR programs is a decade old while new technologies (e.g., hand-held and drone/satellite optical instruments) are becoming available to identify methane leaks. Three main methane emission LDAR programs are identified:
- LDAR using hand-held optical imaging technology (LDRO),
- LDAR using hand-held optical imaging technology with sampling (LDRS), and
- LDAR using large-scale optical imaging technology (LDRL).
The following table provides general background information for this case study.
| Sector: | U.S. Natural Gas Systems; upstream to downstream operations |
| Facility Type: | Production, processing, transmission and storage, and distribution |
| Acres: | N/A |
| Volume: | N/A |
| Owner/Responsible Party: | N/A |
| Description: | Technology and policy review for detection of methane emissions |
| Site Complexities: N/A | |
| Other Pollutants: | N/A |
| Characteristics: | N/A |
| Other: | N/A |
2.0 Technology Utilized
LDAR was used for the study review because it is the current standard and the study indicates it is typically done using optical imaging technology to detects leaks (usually with hand-held IR cameras).
3.0 Assessment
Costs for marginal methane abatement for oil and natural gas subsectors currently range from about $2 per one thousand standard cubic feet (Mcf) of natural gas to more than $5/Mcf methane reduced, depending on the mitigation measures. The figure below displays an estimated marginal abatement cost curve for subsectors in the Gulf Coast region. The least expensive abatement was associated with the production subsector and the most expensive abatement was associated with the transmission and storage subsector. This implies that policies which would allow for averaging or trading of abatement credits or allowances between subsectors would be more cost-effective in aggregate than those policies which do not offer this flexibility.
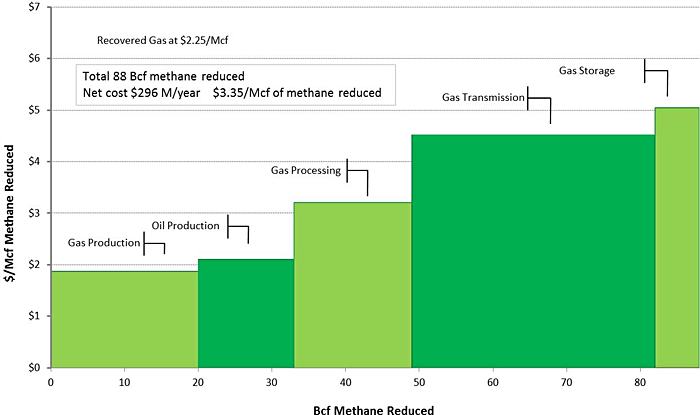
Figure 46. National aggregate marginal abatement cost curve for methane abatement technologies for the oil and gas sector.
Source: (Munnings and Krupnick 2017) (ICF International 2016).
Abatement costs based on specific abatements technologies in various subsectors range from less than -$1 to nearly $8/Mcf of methane reduced. In addition, the cost of the same abatement technology differs among subsectors. The figure below nets out economic benefits from recovered methane. This implies that policies which allow for averaging or trading of abatement credits or allowances between technologies will achieve more cost-effective abatement in aggregate than policies which do not offer this flexibility.
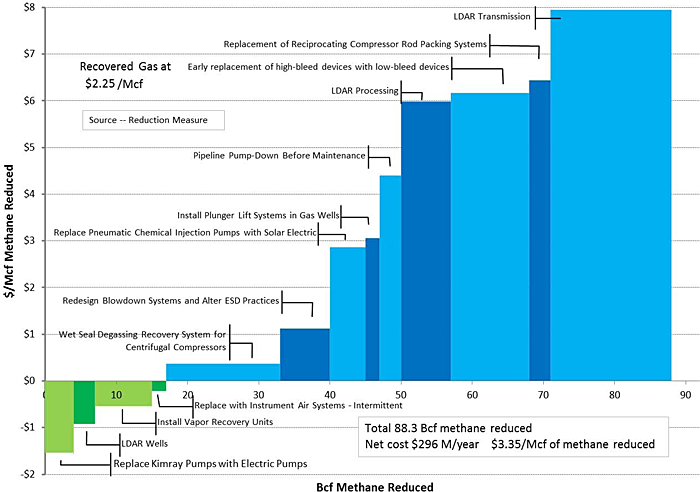
Figure 47. National marginal abatement cost curve for methane abatement technologies for oil and natural gas sector.
Source: (Munnings and Krupnick 2017) (ICF International 2016).
4.0 Case Study Conclusions
Marginal methane abatement costs, averaged within each subsector, ranged from less than $2 to more than $5 per Mcf of methane reduced. The least expensive abatement is associated with upstream operations (production subsector) and more expensive abatement is associated with downstream operations (transmission and storage subsector). Upstream (well production) operations have lower emissions as well as limited distance of pipelines, pumps, and valves, compared to larger-scale downstream operations. Policies which allow for averaging or trading of abatement credits between subsectors and/or technologies will allow for more cost-effective abatement.
The economic effectiveness of LDAR is strongly dependent on the value of captured methane versus costs associated with monitoring and repair.
LDRO reveals if a leak has exceeded a certain threshold, but cannot quantify the rate or value, and monitoring costs can be high due to labor necessary to conduct the monitoring.
LDRS requires the use of LDRO coupled with use of a high-volume sampler to estimate the rate of an emission when a leak is identified. LDRS has high monitoring costs due to the labor necessary for both monitoring and sampling. LDRS is not commonly used.
LDRL has relatively low monitoring costs because of the reduction in associated labor costs to conduct monitoring, but current technologies can identify only relatively large-scale leaks.
A.8 Methane Emissions from Leak and Loss Audits of Natural Gas Compressor Stations and Storage Facilities
Author(s): Derek R. Johnson, April N. Covington, Nigel N. Clark
Date: July 7, 2015
Industry Sector: Natural Gas Midstream
Technology or Methodology Utilized: Eagle II Methane Detector (6 gas sampling), OGI and Microdilution high volume sampling (equipment assembled by research team)
Case Study Link: http://pubs.acs.org/doi/abs/10.1021/es506163m
1.0 Background
Emission estimates based on AP-42 values may not be accurate because actual leak and loss methane emissions are greater than estimates.
The following table provides general background information for this case study.
| Sector: | Natural Gas Midstream |
| Facility Type: | Compressor Station (3 sites) and Storage Facilities (2 sites) |
| Acres: | N/A |
| Volume: | N/A |
| Owner/Responsible Party: | Single owner – unidentified |
| Description: | Barnett Field in Texas |
| Site Complexities: | |
| Other Pollutants: | Methane comprised approximately 94% of the natural gas at all sites. |
| Characteristics: | N/A |
| Other: | N/A |
2.0 Technology Utilized
A handheld methane detection instrument was used to determine localized concentrations of methane as a screening tool for the study. Handheld OGI was used to identify points of interest at elevated locations such as tank hatches or vents, and as a scanning device for the site. OGI was also used to verify that the microdilution high volume sampling (HVS) system adequately captured leaks. Microdilution HVS equipment assembled by the research team [cart-mounted] was used to quantify methane emissions.
The lower detection limit of the methane detector was set 5 ppm above background concentration and was used to examine leaks at ground level and near ground level using ladders. The methane detector reportedly functioned adequately for the intended use of the research team.
OGI is effective in identifying leaks over a wide area and at specific locations. It pairs well with sampling equipment to ensure adequate collection of gases from leaks.
The microdilution HVS train consisted of multiple parts including sample probes, blowers, and various sensors that quantified methane using mass flow rate along with a methane analyzer to determine leak concentration. It is also effective for analytical purposes. The physical size of the equipment may be a limiting factor for practical application.
3.0 Assessment
Relative to each other, the cost for each of the various technologies increases in ascending order of methane detector, HVS, and OGI, with OGI being the most expensive. The cost of methane detector is greater than HVS which is greater than OGI. Alternative technologies include similar equipment sold by other manufacturers.
4.0 Case Study Conclusions
The study was conducted as part of the Environmental Defense Fund’s Barnette Coordinated Campaign where researchers completed leak and loss audits of methane emissions. In this study, three natural gas compressor stations and two natural gas storage facilities all of common ownership were audited. The audit revealed that only 12% of emissions totals were the result of leaks. Methane slip from exhausts represented 44% of total emissions and the remainder is attributed to losses from pneumatic actuators, engine crank cases, compressor packing vents, wet seal vents, and slop tanks. Other observations included that a small number of the total leaks identified were responsible for approximately 50% of emissions from leaks. (Johnson et al. 2015)
A.9 Southwestern Pennsylvania Marcellus Shale Short-Term Ambient Air Sampling Report
Author(s): Pennsylvania Department of Environmental Protection (PA DEP), Bureau of Air Quality
Date: November 1, 2010
Industry Sector: Government
Technology or Methodology Utilized: Mobile Analytical Unit equipped with Gas Chromatography/Mass Spectrometry (GC/MS) and Open Path Fourier Transform Infrared (OP-FTIR) samplers, Canister Sampling, and Infrared Camera
Case Study Link: http://www.dep.state.pa.us/dep/DEPUTATE/AIRWASTE/AQ/aqm/docs/Marcellus_SW_11-01-10.pdf
1.0 Background
With an increase in natural gas exploration activities in the Marcellus Shale, the PA DEP set out to conduct short-term air sampling studies. This report focuses on operations in southwestern counties including Washington and Greene. The goals of the study were to collect ambient air concentrations for a specified list of contaminants, assess air quality impacts, health risks, and make conclusions on whether the short-term study necessitates an expanded scope.
The following table provides general background information for this case study.
| Sector: | Natural Gas |
| Facility Type: | 2 natural gas compressor stations, 1 condensate tank farm, 1 wastewater impoundment, and 1 background site – Southwestern Pennsylvania |
| Acres: | N/A |
| Volume: | N/A |
| Participating Parties: | Stewart Compressor Station near Hickory, PA (Washington County)
Cross Creek Tank Farm near Rea, PA (Washington County) Energy Corp. Compressor Station near Khedive, PA (Greene County) Yeager Impoundment near Washington, PA (Washington County) Florence Commonwealth of Pennsylvania Air Monitoring Station (COPAMS) within Tillman State Park (Washington County) |
| Description: | Variety of natural gas facilities in Southwestern PA, within the Marcellus Shale |
| Site Complexities: | |
| Other Pollutants: | Main pollutants screened for include: methane, ethane, propane, butane, BTEX, methyl mercaptan, carbon monoxide, nitrogen dioxide, and ozone. The PA DEP created a list of target contaminants to screen for based on previous shale gas studies. |
| Characteristics: | N/A |
2.0 Technology Utilized
The selected Gas Chromatograph/Mass Spectrometer (GC/MS) with an air sampler could collect 0.5 L samples over 5-minute time periods, once every hour. OP-FTIR, following USEPA Compendium Method TO-16 enables the detection of 48 VOCs over varying time periods. Air canister samples using USEPA Compendium Method TO-15 serve as subpart-per-billion detection of a large variety of contaminants. An IR camera allowed for detection of leaks which could not be seen with the naked eye.
3.0 Assessment
The applied technology aided discussion and allowed for conclusions to be made for the study goals. The variety of technologies used allowed for data to be collected on a wide range of target contaminants over varying time periods. The results allowed for discussion on the most commonly seen contaminants (methane and benzene), comparison with reference concentrations when adverse health effects are observed, and air quality standards.
4.0 Case Study Conclusions
This sampling campaign found concentrations of natural gas constituents and associated contaminants. Most of the contaminants detected were seen at the two compressor stations. Odorous contaminants (e.g., methyl mercaptan) were detected at levels where an odor would be expected. Based on the sampling performed, it was not expected that air-related health issues would be seen. Also, no level of specified contaminants exceeded the National Ambient Air Quality Standard. OGI camera work was successful at detecting certain pollutants which could not be seen with the naked eye. Although the facility specific level observed showed no overall concern for health or air quality, the cumulative effects over multiple facilities needs to be assessed.
A.10 Northeastern Pennsylvania Marcellus Shale Short-Term Ambient Air Sampling Report
Author(s): PA DEP, Bureau of Air Quality
Date: January 12, 2011
Industry Sector: Government
Technology or Methodology Utilized: Mobile Analytical Unit equipped with Gas Chromatography/Mass Spectrometry (GC/MS) and Open Path Fourier Transform Infrared (OP-FTIR) samplers, Canister Sampling, and Infrared Camera
Case Study Link: https://www.dep.state.pa.us/dep/deputate/airwaste/aq/aqm/docs/Marcellus_NE_01-12-11.pdf
1.0 Background
With an increase in natural gas exploration activities in the Marcellus Shale, the PA DEP set out to conduct short-term air sampling studies. This report focuses on operations in northeastern counties including: Susquehanna and Sullivan. The goals of the study were to collect ambient air concentrations for a specific list of contaminants, assess air quality impacts and health risks, and make conclusions on whether the short-term study necessitates an expanded scope.
The following table provides general background information for this case study.
| Sector: | Natural Gas |
| Facility Type: | 2 natural gas compressor stations, 1 completed and functioning well site, 1 well during fracturing operations, and 1 background site – Northeastern Pennsylvania |
| Acres: | N/A |
| Volume: | N/A |
| Participating Parties: | Cabot’s Lathrop Compressor Station near Springville, PA (Susquehanna County)
Cabot’s Teel site off near Springville, PA (Susquehanna County) Cabot’s Gesford 2V and 7H well, Carter Road near Dimock, PA (Susquehanna County) Stone Energy’s Loomis well site near Lawton, PA (Susquehanna County) Sones Pond parking lot in the Loyalsock State Forest (Sullivan County) |
| Description: | Variety of natural gas facilities in Northeastern Pennsylvania, within the Marcellus Shale |
| Site Complexities: | |
| Other Pollutants: | Main pollutants screened for include: methane, ethane, propane, butane, BTEX, methyl mercaptan, carbon monoxide, nitrogen dioxide, and ozone. The PA DEP created a list of target contaminants to screen for based on previous shale gas studies. |
| Characteristics: | N/A |
2.0 Technology Utilized
2.1 Technology and Reason for Utilization
GC/MS with an Air Sampler could collect 0.5 L samples over 5-minute time periods, once every hour. An OP-FTIR Spectrometer, following USEPA Compendium Method TO-16 detects 48 VOCs over varying time periods. Air canister samples using USEPA Compendium Method TO-15 used subpart-per-billion detection of a large variety of contaminants. An OGI IR camera allowed for detection of leaks which could not be seen with the naked eye and can be used from a distance to scan a large area, then zoom allows for observation of components of interest.
3.0 Assessment
The applied technology aided discussion and allowed for conclusions to be made for the study goals. The variety of technologies used allowed for data to be collected on a wide range of target contaminants over varying time periods. The results allowed for discussion on the most commonly seen contaminants, comparison with reference concentrations when adverse health effects are observed, and air quality standards.
4.0 Case Study Conclusions
This sampling campaign found concentrations of natural gas constituents and associated contaminants. Contaminants were detected at the two compressor stations and the well sites. Odorous contaminants (e.g., methyl mercaptan) were detected at levels where an odor would be expected. Based on the sampling performed, it is not expected that air-related health issues would be seen. Also, no level of specified contaminants exceeded the National Ambient Air Quality Standard. IR camera work was successful at detecting certain pollutants which could not be seen with the naked eye. Although the facility specific level observed showed no overall concern for health or air quality, the cumulative effects over multiple facilities needs to be assessed.
A.11 Improving Methane Emission Estimates for Natural Gas Distribution Companies, Phase II – PE Pipes
Author(s): Khalid Farrag and Kristine Wiley, Gas Technology Institute
Date: November 2013
Industry Sector: Private
Technology or Methodology Utilized: High-Flow Device
Case Study Link: https://www.otd-co.org/reports/Documents/710c_OTD-14-0001-Improving-Methane-Emission-Estimates-NG-Distribution-Companies-PE-Pipes-FinalReport.pdf
1.0 Background
A field testing program was performed to evaluate gas leak rates from below-ground pipelines, provide a simplified procedure that can be used to monitor pipeline leaks from surface measurements, and update the methane emission estimates for the main lines in the distribution system.
The following table provides general background information for this case study.
| Sector: | Private |
| Facility Type: | Utility Facilities |
| Acres: | N/A |
| Volume: | N/A |
| Owner/Responsible Party: | Distribution Operators/local distribution companies (LDCs) |
| Description: | Gas distribution facilities at five locations in the United States where methane leakage is occurring |
| Site Complexities: | |
| Other Pollutants: | N/A |
| Characteristics: | 5 sites were tested (representing both above- and below-ground components). The sites were analyzed for leakage flow and how prominent the leak was. |
2.0 Technology Utilized
A high-flow sampler device was used to calculate leak rates using the flow rate of the sample with the natural gas concentration. is able to quantify and measure flow rates for leakage locations.
3.0 Assessment
Overall, there was reportedly good performance from the sites tested. High-flow devices are unable to completely capture all emissions due to scope, size, and accessibility. Therefore, improvement in the device should enable it to completely capture emissions and give a true reading of leakage levels.
4.0 Case Study Conclusions
Technology has thoroughly advanced in the past 20 years and new methods are allowing for more accurate leakage readings. This study is narrow in scope, but indicates that emission levels have decreased significantly.
A.12 Mobile Laboratory Observations of Methane Emissions in the Barnett Shale Region
Author(s): Tara I. Yacovitch, Scott C. Herndon, Gabrielle Pétron, Jonathan Kofler, David Lyon Mark S. Zahniser, and Charles E. Kolb (Yacovitch et al. 2015)
Date: Published March 9, 2015
Industry Sector: Academia & Government
Technology or Methodology Utilized: Instrumented Vehicle
Case Study Link: http://pubs.acs.org/doi/abs/10.1021/es506352j
1.0 Background
The case study focuses on the need to understand how different measurement and mapping technologies compare for evaluating methane emissions/plumes. To do so, the study mapped methane emission rates using Gaussian simulations. The study used aircraft and land-based systems with multiple groups. Several oil and gas facilities in the Barnett Shale region with large reported methane emissions were visited during this campaign (processing plants, gathering stations, compressor stations, well pads, and roadside piping).
2.0 Technology Utilized
Ground and aircraft-based methods include “instrumented step van with gas-phase … measurement capabilities” and are “operated in parallel drawing from the near-atmospheric pressure portion of the inlet, prior to the pressure controller: a LiCor CO2 analyzer; and a Thermo Fischer NOx detector.” In addition, the methods also feature “Three Aerodyne Tunable IR Laser Direct Absorption Spectroscopy (TILDAS)” and GPS. The reason for the pilot/demonstration of Gaussian dispersion is “to estimate both the source location and the emission magnitude.”
3.0 Assessment
Overall the instrumentation performed well. However, the Gaussiann plume analysis requires some wind. Therefore, no measurements were taken in this study when wind speed was less than 1.0 meter per second.
4.0 Case Study Conclusions
In summary, “plume transect sampling and iterative forward dispersion simulations are useful tools for emissions investigation, allowing large areas to be covered in a short amount of time (in this study, nine plumes per hour of measurement were successfully quantified) without the need for facility access.”
A.13 Toward a Better Understanding and Quantification of Methane Emissions from Shale Gas Development
Author(s): Dana R. Caultona, Paul B. Shepson, Renee L. Santoro, Jed P. Sparks, Robert W. Howarth, Anthony R. Ingraffea, Maria O. L. Cambaliza, Colm Sweeney, Anna Karion, Kenneth J. Davis, Brian H. Stirm, Stephen A. Montzka, and Ben R. Miller
Date: Published April 14, 2014
Industry Sector: Academia & Government
Technology or Methodology Utilized: Instrumented Aircraft
Case Study Link: http://www.pnas.org/content/111/17/6237.full
1.0 Background
The accounting of greenhouse gas emissions has been characterized as “inadequate” and hinders efforts to identify and pursue effective greenhouse gas reduction policies. “The inaccessible and transient nature of these [natural gas] leaks make them difficult to identify and quantify, particularly at a scale at which they are useful for bottom-up inventories or mitigation strategies (i.e., leak rates of individual components or activities).”
This study includes measurements conducted between June 18, 2012 and June 21, 2012 over southwestern PA using Purdue’s Airborne Laboratory for Atmospheric Research, a modified Beechcraft Duchess aircraft. This aircraft was equipped with a “50-Hz Best Air Turbulence probe, described by ref. 36, that measures wind vectors and pressure, a 50-Hz microbead thermistor that measures temperature, a 50-Hz global positioning system/inertial navigation system, and a 0.5-Hz high precision Picarro CO2/CH4/H2O cavity ring down spectrometer (CRDS). The CRDS has approximately 0.05% (1 ppb) precision for methane determined during in-flight calibration, and comparable accuracy, using three NOAA Earth System Research Laboratory tanks with methane concentrations of 1.8030, 2.2222, and 2.5995 ppm. A programmable flask package provided by NOAA for whole-air sampling was also installed on the aircraft. The programmable flask package consisted of 12 flasks that held air pressurized to 2.7 atm in 0.7-L bottles. Flasks were analyzed for 55 species, including CH4, and hydrocarbons, by NOAA.”
An instrumented aircraft platform was used to identify large sources of methane and quantify emission rates in southwestern PA, a region encompassing a large number of both individual and clustered well pads.
2.0 Technology Utilized
The study utilized “an aircraft-based approach that enables sampling of methane emissions between the regional and component level scales and can identify plumes from single well pads, groups of well pads, and larger regional scales, giving more information as to the specific CH4 emission sources.” Three types of flights were implemented over 2 days in June 2012: investigative (I), mass balance flux (MB), and regional flux (RF).” The study objective was to evaluate the use of instrumented aircrafts using cavity ring down spectroscopy for delineating regional methane fluxes i.e., use a ‘top-down’ data aggregation approach for evaluating methane emissions.
3.0 Assessment
The aircraft is not suitable for high resolution sampling at all sites but provides ‘big picture’ mapping of emissions over larger area. There was good overall performance.
4.0 Case Study Conclusions
Aircraft monitoring is suitable for developing integrated maps of emissions “at scales relevant to bottom-up inventories and mitigation strategies and to estimate the emission rate for a region encompassing a large number of well pads.”
A.14 Measuring Emissions from Oil and Natural Gas Well Pads Using the Mobile Flux Plane Technique
Author(s): Chris W. Rella, Tracy R. Tsai, Connor G. Botkin, Eric R. Crosson, and David Steele (Rella et al. 2015)
Date: March 25, 2015
Industry Sector: O&G
Technology or Methodology Utilized: Mobile Flux Plane Technique
Case Study Link: https://pubs.acs.org/doi/abs/10.1021/acs.est.5b00099
1.0 Background
Measuring fugitive methane emission rates from oil and natural gas well pads can be time-consuming, inefficient, and cause underestimation of total methane emissions when individual component’s emission rates are aggregated. The authors of this paper present a novel technique which allows for calculation of total well pad emissions that is rapid and efficient and does not require access to site infrastructure. The study was to assess the capabilities (both in a controlled experiment and field setting) of the technique and draw conclusions on emission rates in the Barnett Shale, Texas.
The following table provides general background information for this case study which was conducted for the Barnett Shale in Texas (Counties: Cooke, Denton, Hood, Johnson, Montague, Parker, Tarrant, Wise, and Somervell)
| Sector: | Oil and Natural Gas |
| Facility Type: | 200 oil and gas well pads |
| Acres: | N/A |
| Volume: | 207 sampling events performed |
| Owner/Responsible Party: | No physical access was given to sites |
| Description: | Oil and gas well pads in nine counties within the Barnett Shale well pads sampled were in close proximity (<150 m) to public roads. |
| Site Complexities: | |
| Other Pollutants: | Only methane was sampled |
| Characteristics: | Sites needed to have public road access in proximity (<150 m) to the well pad. Sites also needed to be assessed using publicly available satellite imagery such that an intercepted plume would contain emissions only from that well pad. Lateral wind speed needed to be greater than 1.0 meter per second. Plume geometry needed to fall within the constraints of the sampling pole (4.2 m in height) |
2.0 Technology Utilized
The study used a modified version of a commercially-available, near-infrared laser-based Cavity Ring-Down Spectrometer (CRDS), using real-time methane concentration analysis (2 Hz) with subparts-per-billion accuracy and precision. A submeter-resolution GPS unit with real-time location and vehicle speed was also used. A sampling mast consisting of one monitoring port and six gas inlets evenly spaced over 4.2 m and connected to AirCores capable of holding 50 s of sampled air allowed for a planar sample to be collected in 5 minutes using one gas analyzer.
The modified version of a commercially-available, near-infrared laser-based CRDS, effectively sampled methane concentrations using the Mobile Flux Plane Technique. A sonic anemometer provided wind direction and speed data for the study. A submeter-resolution GPS unit provided required data for the study.
A sampling mast consisting of one monitoring port and six gas inlets evenly spaced over 4.2 m, connected to AirCores capable of holding 50 s of sampled air effectively provided a planar sample, which could apply a limited Gaussian plume model to calculate the flux from a well pad.
3.0 Assessment
With significant data interpretation to identify reliable well pad samples, the authors detected 115 emitting well pads and 67 non-emitting well pads from a total of 207 samples taken. It was found that for the emitting wells, the arithmetic mean was 1.72 kg/h (though highly skewed) and 95% emitted between 0.037 and 10.5 kg/h, including the non-emitting well pads the arithmetic mean was found to be 1.1 kg/h. The authors stated that 50% of emissions is a result of 6.6% of the highest emitting wells, and 80% is a result of 22% of the highest emitting wells.
The biases that arose in the Barnett data set are a result of the authors only sampling wells with public road access within 150 m of the well pad. Plume geometry limits the use of collected data. If the sampling plane does not collect the extent of the plume in either the horizontal or vertical direction, then the data cannot be used. This is assessed by comparing the centroid of the plume to the size of the sampling mast. In addition, the collected data was not compared to other methods for methane emission determination. Therefore, the validity of the data set cannot be verified. However, a validation experiment showed measurement precision with a geometric standard deviation of 1.9, accuracy of 24%, and a detection limit of 0.034 kg/h. For measurements greater than 3.6 times the detection limit, the accuracy is found to be greater than 95%.
The reported technique is unique in that it does not require site access. Alternatives include disaggregated high volume dilution sampling of well pad components and dual tracer releases.
4.0 Case Study Conclusions
This study was the first to apply the Mobile Flux Plane Technique. Based on the data collected, this technique can be used to assess a well pad’s total methane emission rate. The finding that 80% of emissions are a result of 22% of wells suggests (if this finding can be verified) that this technique can be deployed rapidly to find the highest emitting well pads. This would allow (with strategic management) for a large reduction of total emissions if highest emitters were targeted for corrective measures.
A.15 Methane Emissions from Natural Gas Compressor Stations in the Transmission and Storage Sector: Measurements and Comparisons with the EPA Greenhouse Gas Reporting Program Protocol
Author(s): R. Subramanian, Laurie L. Williams, Timothy L. Vaughn, Daniel Zimmerle, Joseph R. Roscioli, Scott C. Herndon, Tara I. Yacovitch, Cody Floerchinger, Daniel S. Tkacik, Austin L. Mitchell, Melissa R. Sullivan, Timothy R. Dallmann, and Allen L. Robinson
Date: February 10, 2015
Industry Sector: Academic & Private
Technology or Methodology Utilized: On-Site Direct Measurement of Fugitive and Vented Sources combined with AP-42-based Exhaust Emissions Factors versus Downwind Tracer Flux (i.e., bottom-up versus top-down estimates)
Case Study Link: http://pubs.acs.org/doi/abs/10.1021/es5060258
1.0 Background
This study investigates the uncertainty in site-level emission estimates of the USEPA Greenhouse Gas Inventory and EPA Greenhouse Gas Reporting Program using two independent estimates as a basis for emissions inventories.
The following table provides general background information for this case study.
| Sector: | Transmission and Storage of Natural Gas |
| Facility Type: | Total of 45 natural gas compressor stations; 36 transmission and 9 underground storage |
| Acres: | Various |
| Volume: | Various |
| Participating Parties: | Six private partner companies |
| Description: | Selection of sites for study based on; geographic location, technology, partner company greenhouse survey team schedules, and suitability for tracer flux measurements. Study encompassed16 States in the South, Mid-Atlantic, Northeast, Midwest & Mountain West). |
| Site Complexities: | |
| Other Pollutants: | Specific to natural gas system transmission and storage |
| Characteristics: | Multiple natural gas sites included in study |
| Other: | Thermogenic (natural gas) methane and biogenic methane |
2.0 Technology Utilized
Down-wind tracer flux measurements quantify aggregate, site-level emissions of methane for large complex sites with multiple leak points. On-site measurements consisted of comprehensive leak detection followed by direct measurement except for inaccessible sources and unburned methane in engine/turbine exhaust, which were estimated.
3.0 Assessment
The study identified a small number of sites contributing disproportionately to overall study emissions. Sites with less than 200 standard cubic feet per minute flow (i.e., a majority of the sites in study) had reasonable agreement between the two measures of site-level emissions with tracer flux estimating somewhat higher emissions rates then on-site measurements. The highest emitting sites had substantial underestimates of emissions by on-site direct measurement but were captured more fully by tracer flux.
There were highly skewed emissions dominated by a small number of sites, which may not be captured by measurements, have important implications for construction of reliable emission inventories.
The value of the Greenhouse Gas Reporting Program could be improved by utilizing more direct measurements of emissions (versus using counts and emissions factors), avoiding use of acoustic devices, eliminating certain exclusions, and using more appropriate emissions factors.
4.0 Case Study Conclusions
The collection of down-wind tracer flux measurements is adequate site-wide but does not identify specific sources driving emissions. On-site measurements are adequate for low emitters but underestimated large emitters in the study.
Highly skewed emissions dominated by a small number of sites that may not be captured by measurements have important implications for construction of reliable emission inventories.
A.16 Direct Measurements Show Decreasing Methane Emissions from Natural Gas Local Distribution Systems in the United States
Author(s): Brian K. Lamb, Steven L. Edburg, Thomas W. Ferrara, Touché Howard, Matthew R. Harrison, Charles E. Kolb, Amy Townsend-Small, Wesley Dyck, Antonio Possolo, and James R. Whetstone
Date: March 31, 2015
Industry Sector: Government & Private
Technology or Methodology Utilized: High-Flow Sampling Method and Downwind Tracer-Ratio Method
Case Study Link: http://pubs.acs.org/doi/abs/10.1021/es505116p
1.0 Background
Two methods, high-flow sampling and downwind tracer-ratio, can be used in order to accurately determine the amount of methane emissions from natural gas in local distribution systems in the U.S. This case study examined ways to better detect and quantify the problems of leakage in natural gas distribution systems across the U.S.
The sample locations consist of metering and regulating facilities with inlet pressures between 100 and 300 psi, plastic mains, unprotected steel services, unprotected steel mains, cast iron mains, regulators > 200 psi, metering and regulation facilities > 300 psi, and regulators 100-300 psi, including transmission-distribution transfer stations.
The following table provides general background information for this case study.
| Sector: | Government and Private |
| Facility Type: | Local Distribution Systems |
| Acres: | N/A |
| Volume: | N/A |
| Participating Parties: | Local distribution companies |
| Description: | Tests were conducted at numerous distribution system sites across the U.S. in an effort to quantify current methane emission levels |
| Site Complexities: | |
| Other Pollutants: | N/A |
| Characteristics: | Multiple device types had to be used due to varying size and scope of leakage locations |
| Other: | N/A |
2.0 Technology Utilized
Two methods were utilized in this case study: high-flow sampling and downwind tracer-rate. The high-flow sampling method encloses the leak and is able to capture all of the gas. The method uses catalytic oxidation and thermal conductivity hydrocarbon sensors to measure the methane concentration in the air stream. A thermal gas flow sensor then measures the sample flow rate. The high-flow sampling method measures the flow rate of the leak and has a modified enclosure that completely captures the leaking gas. Downwind tracer-ratio measurements were used for quality assurance and allowed for readings within the experimental uncertainty.
3.0 Assessment
Overall, the technologies functioned well in quantifying all of the gas emission from each site. There were several limitations that impeded the ability to collect numerous samples including limited accuracy of the process, as well as the limited number of sites tested. Consequently, the gathering of multiple samples for interpretation was relatively low. Additional testing would help to ensure a more comprehensive capture of emissions for interpretation.
4.0 Case Study Conclusions
Compared to the previous Gas Research Institute/EPA testing, these results are more accurate and use improved technologies. The high-flow sampling method needs verification, but results are rather effective. The method assists in determining if there are any leaks in the high-flow sampling method.
A.17 Methane Emissions Estimate from Airborne Measurements over a Western United States Natural Gas Field
Author(s): Anna Karion, Colm Sweeney, Gabrielle Pétron, Gregory Frost, R. Michael Hardesty, Jonathan Kofler, Ben R. Miller, Tim Newberger, Sonja Wolter, Robert Banta, Alan Brewer, Ed Dlugokencky, Patricia Lang, Stephen A. Montzka, Russell Schnell, Pieter Tans, Michael Trainer, Robert Zamora, and Stephen Conley (Karion et al. 2013)
Published: August 3, 2013
Industry Sector: Production
Technology or Methodology Utilized: Methane mass balancing using aircraft mounted measurements
Case Study Link: http://onlinelibrary.wiley.com/doi/10.1002/grl.50811/full
1.0 Background
The case study was initiated by the lack of accurate and reliable emissions estimates from natural gas production. Many methane emission calculations are estimated “bottom up” using emission factors. The national average production-sector leak rate is an ever changing number as USEPA revises assumptions for calculating emissions. Regional variations and more accurate emission factors and approaches are needed.
The following table provides general background information for this case study.
| Sector: | Production |
| Facility Type: | Oil and gas field with 4,800 gas wells and nearly 1,000 oil wells |
| Acres: | 593,053 acres |
| Volume: | N/A |
| Participating Parties: | Multiple parties located in Uintah Basin, Uintah County |
| Description: | The current method of estimating emissions may be drastically underestimating. By taking measurements via aircraft from a concentrated production field, researchers asserted that inventory estimates are too low. The determined average leak rate of 8.9 +/-2.7% is a factor of 1.8 greater than U.S. Government Accountability Office (GAO) estimates. Additionally, the GAO included both flaring and venting. This study did not account for methane converted to CO2 therefore additional study is needed. |
| Site Complexities: | |
| Other Pollutants: | Not noted |
| Characteristics: | Uintah Basin/County is well suited to measurement with aircraft because the wells are concentrated in a manageable area. |
| Other: | N/A |
2.0 Technology Utilized
The emissions estimate was taken via a mass balance approach for deriving CH4 fluxes using measurement from aircraft. The method was used because current estimating scenarios do not accurately depict fugitive emissions.
3.0 Assessment
The performance of the technology was good. The limitation with the technology was that the measurements are a snapshot. Therefore, additional testing is necessary.
4.0 Case Study Conclusions
It was noted that the aircraft’s mounted measurement showed inaccuracies within emission factors.
The study concluded that the leak rate during production is costly to both the bottom line and the environment and is not being accurately estimated at present. As stated by the authors of the paper, “Given the large global warming potential of CH4, a natural gas leak rate of 6.2% – 11.7% during production negates any short-term (i.e., less than 70 years) climate benefit of natural gas for electricity generation compared to coal and oil.
A.18 Reconciling Divergent Estimates of Oil and Gas Methane Emissions
Author(s): Daniel Zavala-Araiza, David R. Lyon, Ramón A. Alvarez, Kenneth J. Davis, Robert Harriss, Scott C. Herndon, Anna Karion, Eric Adam Kort, Brian K. Lamb, Xin Lan, Anthony J. Marchese, Stephen W. Pacala, Allen L. Robinson, Paul B. Shepson, Colm Sweeney, Robert Talbot, Amy Townsend-Small, Tara I. Yacovitch, Daniel J. Zimmerle and Steven P. Hamburg (Zavala-Araiza et al. 2015)
Date: December 7, 2015
Industry Sector: Oil and Gas Facilities
Technology or Methodology Utilized: Aircraft Mounted Measurement Systems
Case Study Link: http://www.pnas.org/content/112/51/15597.abstract
1.0 Background
Published estimates of methane emissions are not accurate, which leads to conflicting claims about the climate implications of switching from coal or petroleum to natural gas.
The following table provides general background information for this case study.
| Sector: | Oil and Gas Facilities |
| Facility Type: | Flyover of various facilities in the Barnett Field; Production facilities approximately 53% of total), compressor stations approximately 31% of total), processing plants approximately 13% of total), and others. |
| Acres: | N/A |
| Volume: | N/A |
| Participating Parties: | Various |
| Description: | Barnett Field in Texas |
| Site Complexities: | |
| Other Pollutants: | N/A |
| Characteristics: | N/A |
| Other: | N/A |
2.0 Technology Utilized
Aircraft mounted sampling equipment was used to examine a top-down approach for estimating methane emissions.
3.0 Assessment
Resource requirements to operate aircraft mounted systems have the potential to make the technology impractical for most applications.
4.0 Case Study Conclusions
It was difficult to discern the effectiveness of the aircraft mounted sampling equipment employed in this study.
Methane emissions are significantly higher than estimates based on public inventories. Barnett methane emissions are dominated at any one time by a small number of high emitters. It is estimated that 2% of facilities in the Barnett region are responsible for half of the emissions, and 10% are responsible for 90% of emissions. The “high emitters’ are divided roughly equally among production sites, compressors, and processing plants. (Zavala-Araiza, et al. 2015)
A.19 Greater FocusNeeded on Methane Leakage from Natural Gas Infrastructure
Author(s): Ramón A. Alvareza, Stephen W. Pacalab, James J. Winebrakec, William L. Chameidesd, and Steven P. Hamburge. Contributed by Stephen W. Pacala
Date: February 13, 2012
Industry Sector: No specific industry is included
Technology or Methodology Utilized: Calculation of U.S. specific fuel-switching scenarios
Case Study Link: http://www.pnas.org/content/pnas/109/17/6435.full.pdf
1.0 Background
Natural gas has the potential to lead to a shift away from other fossil fuels. However, for this shift to happen, the leakage rates in the natural gas supply network in the U.S. should be studied and compared to other fossil fuels for GHG emissions (primarily associated with methane and CO2). The potential for methane leakage to otherwise diminish the gains from using methane versus other fuel technologies was explored. The concept of global warming potential (GWP) is defined as the amount of energy added to the Earth’s climate system by 1 kg of a gas relative to 1 kg of CO2. As the reference GHG, CO2 is given a GWP value of 1. This is used to compare the radiative forces of different gases to carbon dioxide (CO2) and represents the ratio of cumulative radiative forcing from emission of an equivalent quantity of CO2. The Intergovernmental Panel on Climate Change uses a 100-year timeframe for the calculation, emphasizing the 20-year GWP, which emphasizes the early forcing years from early CH4 emissions. One of the limitations for this approach is they only consider the radiative forces of single pulse emissions, which do not capture the climatic consequences of real world investment and policy decisions that are better simulated as emissions streams.
2.0 Technology Utilized
This study evaluated several other studies’ data and compared to their own data to draw conclusions and recommendations with regard to the implications with fuel-switching scenarios and consequent effect on methane and CO2 emissions. Uncertainty and potential underreporting of methane leakage rates minimizes potential gains associated with the use of natural gas in place of other fuels.
3.0 Assessment
The paper uses USEPA’s current estimates of methane leakage from natural gas production and delivery infrastructure, in addition to a modest methane contribution from compressed natural gas (CNG)-fueled vehicles. Converting a fleet of gasoline cars to CNG increases radiative forcing for 80 years before any net climate benefits are achieved; the comparable cross-over point for heavy-duty diesel vehicles is nearly 300 years. Stated differently, converting a fleet of cars from gasoline to CNG would result in numerous decades of more rapid climate change because of greater radiative forcing in the early years after the conversion. This is eventually offset by a modest benefit. After 150 years, a CNG fleet would have produced about 10% less cumulative radiative forcing than a gasoline fleet; a benefit equivalent to a fuel economy improvement of 3 mpg in a 30 mpg fleet. CNG vehicles fare even less favorably in comparison to heavy-duty diesel vehicles.
In order to provide guidance to industry and policymakers, the paper uses the maximum well-to-wheels or well-to-burner tip leakage rate to ensure the net climate benefits on all timeframes after switching fuel to natural gas. The current estimated leakage rate is 4% for the entire natural gas supply. For a fuel switching scenario to be viable, this leakage rate would need to be reduce by 45% to 1.6%. At this rate, CNG cars would provide an immediate climate benefit and would improve over time. For heavy duty vehicles, this rate would have to be reduced to less than 1%. For a switch from coal power plants to new natural gas plants, the leakage rate must also be reduced to below 1%.
4.0 Case Study Conclusions
A major assumption is that this entire comparison is based on these rates as a calculation of an average of the entire U.S. natural gas supply. The paper emphasizes that much work needs to be done to determine actual emissions and accuracy to characterize site-to-site variability in emissions.
A.20 Determination of total Methane Emissions from the Aliso Canyon Natural Gas Leak Incident
Author(s): California Air Resources Board (CARB 2016)
Date: October 21, 2016
Industry Sector: Oil and Gas
Technology or Methodology Utilized: Airborne flight measurements, inventory verification, tracer flux ratio study, and ground-based remote sensing
Case Study Link: https://www.arb.ca.gov/research/aliso_canyon/aliso_canyon_methane_emissions-arb_final.pdf
1.0 Background
On October 23, 2015, a large natural gas leak was discovered at the Southern California Gas (SoCalGas) Aliso Canyon storage facility. It was discovered that a breach in storage infrastructure below ground was discharging large volumes of methane to the atmosphere. The leak was controlled on February 11, 2016. The Governor of California issued a proclamation that SoCalGas must fund a program to “fully mitigate the leak’s emissions of methane.” (See the full report for reference.) To do so, the amount of methane released to the atmosphere needed to be estimated, and the California Air Resources Board assessed methodologies to delineate the upper bound of the estimated methane release.
The following table provides general background information for this case study.
| Sector: | Oil and Gas |
| Facility Type: | Natural gas storage facility; Aliso Canyon in Los Angeles County California |
| Acres: | N/A |
| Volume: | 109,000 metric tons of methane |
| Owner/Responsible Party: | SoCalGas |
| Description: | Natural gas storage facility where extraction occurs during November-March and injection occurs during April – October |
| Site Complexities: | |
| Other Pollutants: | N/A |
| Characteristics: | Released methane exited the well with considerable upward velocity. Multiple leakage points created complexity in measurement. Site has complex terrain and wind patterns. Evidence suggests that the methane plume became bi-modal, making it difficult to capture the entire plume for some measurement techniques. Road access downwind presented challenges for measurement techniques. |
| Other: | N/A |
2.0 Technology Utilized
Airborne measurements allow for measurement within the plume, therefore the entire plume can be captured. Inventory verification allows for the estimation of leakage through pressure measurements within the reservoir and using instrumentation already in place. Tracer flux ratio study is a well-practiced technique for estimating emissions from a point source. Ground-based remote sensing and ground-based spectrometers measure continuous frequency while also having pre- and post-leak data available.
3.0 Assessment
The ARB assessed all of the techniques used to estimate the total methane released. In order to develop the final estimated airborne measurements and application of the Weymouth Equation (which uses reservoir pressures), the leakage time period was broken into two phases: Phase I – Initial Leak and Well Control Attempts and Phase II – Drawdown. Using this technique, the ARB stated the final amount of methane released was 99,650 ± 9,300 MT and used the upper bound of 109,000 MT.
4.0 Case Study Conclusions
Airborne measurements’ effectiveness depended on the integration method used. Using two different methods (not outlined in this case study), estimates were 94,500 metric tons (MT) and 97,100 MT. Inventory verification estimated leakage was 84,221 MT with an uncertainty of 125%. Tracer flux ratio study yielded an estimate of 86,022 ± 8,393 MT. Underestimation is thought to be due to having a multi-point source, lack of mixing of the plume and tracer, the entire plume may not have been captured due to road access, and a lack of measurements prior to December 21, 2015. Ground-based remote sensing and ground-based spectrometer yielded an estimate of 100,050 ± 23,562 MT.
The study concluded that using this application of airborne measurement, coupled with the described analysis, was the most accurate estimate for total methane emissions. Using this technique, the total methane identified to require mitigation to offset the leak was 109,000 MT.
A.21 Comparing Natural Gas Leakage Detection Technologies Using an Open-Source “Virtual Gas Field” Simulator – Fugitive Emissions Abatement Simulation Toolkit (FEAST)
Author(s): Chandler E. Kemp, Arvind P. Ravikumar, and Adam R. Brandt (Kemp, Ravikumar, and Brandt 2016)
Date: March 23, 2016
Industry Sector: Oil & Gas
Technology or Methodology Utilized: Open Source Model
Case Study Links:
http://pubs.acs.org/doi/abs/10.1021/acs.est.5b06068
https://eao.stanford.edu/research-areas/FEAST
1.0 Background
Fugitive methane emissions from a natural gas system are an important source of anthropogenic greenhouse gases. LDAR programs aim to reduce fugitive methane emissions while providing additional revenue to natural gas producers from the sale of recovered gas. LDAR is an area of active research, and many proposed LDAR concepts rely heavily on new technologies, including constant monitoring of gas wells with high-precision methane sensors, automated surveys of natural gas fields based on IR camera technology, or remote sensing of methane plumes using platforms such as aircraft or satellites. The objective is detection and repair performance.
This study was based on modeling therefore locations are all virtual.
2.0 Technology Utilized
The article focused on the development of the Fugitive Emissions Abatement Simulation Toolkit (FEAST) model to explore the effect of various LDAR programs on long-term leakage rates. FEAST is an open-source model programmed in a multi-paradigm numerical computing environment.
3.0 Assessment
A stochastic model used to model randomly changing systems is implemented in three basic steps:
- gas field initialization
- dynamic simulation
- results storage
A FEAST scenario is defined by the user-defined settings, inputs, and underlying data set provided to FEAST. FEAST is stochastic; results will change each time it runs a particular scenario. Numerous realizations (scenarios) must be analyzed to understand the implications of a particular scenario.
4.0 Case Study Conclusions
The economic analysis of various LDAR programs presented in the study is only indicative of general trends. Extrinsic factors such as leak production rates and gas price play an out-sized role in determining the value of various LDAR programs. In addition, calculations are operator-centric. The model may help to select an LDAR program that provides the best cost-benefit for a particular scenario, particularly compared to a site without an explicit LDAR program.
A.22 Methane Emissions Technology Evaluation Center (METEC) – in collaboration with Advanced Research Projects Agency – Energy; Methane Observation Networks with Innovative Technology to Obtain Reductions (ARPA-E; MONITOR)
Author(s): Daniel Zimmerle, Colorado State University
Date: October 1, 2016 and ongoing
Industry Sector: Government-supported, academic-led technology assessment and development
Technology or Methodology Utilized: Assessment of numerous technologies and applications at a target facility
Case Study Links:
https://methane.stanford.edu/
https://arpa-e.energy.gov/sites/default/files/documents/files/MONITOR_ProgramOverview.pdf
https://energy.colostate.edu/metec/
1.0 Background
Numerous technologies are available for measurement of methane levels with different degrees of selectivity, sensitivity, accuracy, and consequent cost to implement. The primary barrier to widespread utilization of continuous or semi-continuous methane measurement is cost. The goal of this program is to support the development of approaches for methane detection and measurement to enable and encourage widespread utilization to facilitate reductions in methane emissions.
The following table provides general background information for this case study.
| Sector: | For evaluation at the well pad and further downstream. Initial focus on dry gas emissions, small production well pads, and small equipment groups with future application to gathering and field compression sites, gas processing plants, compressor stations, and local distribution stations. |
| Facility Type: | Model research test facility site consisting of model well pads; Fort Collins, Colorado. |
| Acres: | Three test pads up to approximately 1,100 square feet in area |
| Volume: | Threshold leak size for technical performance targets detection is 6 standard cubic feet per hour (SCFH) (1 ton/year) with range of emission rates from 0-150 SCFH |
| Participating Party: | Colorado State University |
| Description: | Round 1; Model production test pads with leakage possible for purposes of research and assessment from anywhere on the pads:
|
| Site Complexities: | |
| Other Pollutants: | Minimal non-specific pollutants unless otherwise introduced as part of assessment activities |
| Characteristics: | Controlled research environment |
| Other: | Future planned development of METEC (Round 2) to include larger well pads, mock mid-stream compression facility, and subsurface pipeline test bed for simulation of wet gas and mid-stream operations |
2.0 Technology Utilized
Various technologies were employed in the study in order to conduct research.
3.0 Assessment
Non-specified initial testing has been conducted at the METEC facility as part of the start-up activities and provides data to improve measurement technologies. Future development will provide additional potential scenarios for testing. Improvement in conclusions can be aided by on-going testing.
4.0 Case Study Conclusions
This test facility has recently come online and has the opportunity to produce significant data on testing equipment and methodologies. The widespread utilization of continuous or semi-continuous methane measurement remains a work in progress.
A.23 Mobile Monitoring Challenge
Author(s): Arvind P. Ravikumar, Jingfan Wang, and Adam R. Brandt
Date: TBD – In 2018
Industry Sector: Oil & Gas
Technology or Methodology Utilized: Methane Leak Detection Systems
Case Study Link: https://methane.stanford.edu/
https://arpa-e.energy.gov/sites/default/files/documents/files/MONITOR_ProgramOverview.pdf
1.0 Background
The goal of the mobile monitoring challenge is to compare mobile methane detection technologies with comparisons performed in a single-blind format. The study objective is to evaluate mobile methane leak detection systems for rapid, cost-effective surveys at oil and gas facilities.
2.0 Technology Utilized
Specific to mobile methane detection technologies which does not include fixed or handheld solutions.
3.0 Assessment
Methane release details are 8-hour per day releases for 15 days spread over three separate release weeks. Volumes will be held constant for 15-30 minute intervals and will be blinded to the study teams. Releases will occur from one or more release points.
4.0 Case Study Conclusions
A.24 Methane Detectors Challenge
Author(s): Environmental Defense Fund; Southwest Research Institute (John Edlebeck, Adam Janka, and Shane Siebenaler)
Date: December 9, 2014 (Phase 1 Report); September 18, 2015 (Phase 2 Report)
Industry Sector: Non-profit
Technology or Methodology Utilized: Evaluation of five innovator technologies (tunable diode laser absorption spectroscopy, non-dispersive infrared, chemical sensors)
Case Study Link: https://www.edf.org/methane-detectors-challenge
http://business.edf.org/files/2016/01/mdc_phase_1_revised_report.pdf?_ga=2.15228854.1293175296.1529430353-1992905573.1459967780
http://business.edf.org/files/2016/01/mdc_phase_2_final_report.pdf
1.0 Background
Methane Detectors Challenge (MDC) is a partnership between Environmental Defense Fund, oil and gas companies, and technology developers to assess the performance of methane leak detection systems. The partnership, which launched in 2014, evaluated systems for their ability to detect (not quantify or locate) high emission rate fugitive sources at oil and gas sites.
The following table provides general background information for this case study.
| Sector: | Non-profit |
| Facility Type: | Test facility; San Antonio, Texas |
| Acres: | N/A |
| Volume: | N/A |
| Participating Party: | Southwest Research Institute |
| Description: | Phase 1 testing occurred in an indoor laboratory with controlled environment chambers. Phase 2 testing occurred in both the laboratory and an outdoor testing facility. |
| Site Complexities: | |
| Other Pollutants: | CO2, CO, and C2H6 were tested to assess potential interference with methane measurements |
| Characteristics: | N/A |
| Other: | N/A |
2.0 Technology Utilized
Leak detection systems were evaluated with a series of indoor and outdoor tests assessing several metrics including accuracy, precision, sensitivity to other gases, and ability to detect a controlled release. A CRDS and an open path laser analyzer were used as reference instruments when assessing the accuracy of concentration measurements.
3.0 Assessment
Phase 1 testing determined that four out of the five technologies had adequate performance measuring methane concentrations in a laboratory environment. Phase 2 testing found that three of these technologies performed successfully in an outdoor testing environment. Currently, two technologies are being assessed for their ability to detect leaks as part of operator field trials.
4.0 Case Study Conclusions
The MDC was the first recent program to evaluate innovative leak detection systems, successfully evaluate concentration metrics, and possess a basic ability to detect large emissions in phased testing. Ongoing operator field trials are assessing the ability of systems to detect fugitive emissions.
A.25 Good versus Good Enough? Empirical Tests of Methane Leak Detection Sensitivity of a Commercial Infrared Camera
Author(s): Arvind P. Ravikumar, Jingfan Wang, Mike McGuire, Clay S. Bell, Daniel Zimmerle, and Adam R. Brandt (Ravikumar et al. 2018)
Date: January 19, 2018
Industry Sector: Academic-led technology assessment
Technology or Methodology Utilized: IR camera in a controlled release environment
Case Study Link: https://pubs.acs.org/doi/abs/10.1021/acs.est.7b04945
1.0 Background
The purpose of the study was to improve the understanding of OGI technologies through independent empirical analysis. This was conducted using metered leaks from a controlled-release facility that replicates a natural gas production well-site. Leaks were examined under different environmental and imaging conditions by a trained OGI-operator. Leak sizes were not disclosed to the operator during the experiments and were independently controlled in a randomized, single-blind study design. Results were used to generate functions for detection probability as a function of leak size and distance as well as the role of wind conditions and other environmental factors.
The following table provides general background information for this case study.
| Sector: | Evaluation at the well pad and further downstream |
| Facility Type: | METEC research test facility consisting of model well pads; Fort Collins, Colorado |
| Acres: | Model well test pads up to approximately 1,100 square feet in area |
| Volume: | Controlled releases ranging from 33 to 330 g/h (2 to 20 standard cubic feet per hour) methane at O&G components (flange, vent, and valves) |
| Participating Party: | Colorado State University |
| Description: | Single-blind, controlled release testing of OGI to develop detection probability curves. Two controlled experiments consisting of:
|
| Site Complexities: | |
| Other Pollutants: | Non-specific pollutants were not introduced as part of assessment activities |
| Characteristics: | Controlled research environment using experienced OGI operators |
| Other: | During this study, 90% of 5-minute average wind speed were less than 4.3 m/s, with an experiment-averaged mean wind speed of 3± 1.3 m/s. |
2.0 Technology Utilized
Many O&G operators have adopted OGI for LDAR surveys due to its convenience and also because there are no cost-effective USEPA-approved alternative technologies. However, there has been little systematic study of the limits and effectiveness of OGI in real world conditions.
3.0 Assessment
Testing indicated a 90% probability of detecting 20 g/h at 10 feet. A 3 to 6-meter view distance should result in 90% detection of 30 g/s (analogous to USEPA NSPS OOOOa OGI requirement).
OGI detection limits were an order of magnitude higher than determined by previous laboratory testing, likely due to sub-optimal and changing conditions in field.
Wind speeds during this study were below 4.3 m/s (10 mph) and speeds at or below are likely acceptable for leak detection. However, the relationship between higher wind speeds (greater than 5 m/s) and leak detection probability requires additional study.
Due to the positively skewed nature of O&G methane emissions, a high detection limit leak can result in equivalent emission reductions as lower detection limits are approached (median detection limit of 100 g/h maximizes reductions from periodic surveys).
4.0 Case Study Conclusions
OGI has a relatively high detection limit under field conditions, but typically is good enough to effectively reduce emissions as part of a periodic LDAR program. Due to the positively skewed nature of O&G methane emissions, a high-detection can result in equivalent emission reductions as the lower detection limit is approached.
Regulators should consider high-detection limit approaches since they may result in equivalent or better emission reductions. The study demonstrated that the typical 90% leak detection threshold of OGI is about 20 g CH4/h at an imaging distance of 3 m, which is in line with USEPA recommendations. However, it is not clear if higher sensitivity (lower 90% detection threshold) would lead to increased practical emissions mitigation.
Publication Date: September 28, 2018

