5 Evaluation Guidelines and Principles
In response to a growing interest and growth in innovative leak detection systems, there has been a concurrent development of approaches for evaluating the performance of these systems. The evaluation of leak detection systems should be based on an objective assessment of technology-neutral, quantitative metrics directly related to stakeholder goals. As discussed in Section 4, there are numerous sensor technologies and applications that can be used to detect, locate, and/or quantify methane emissions, including stationary arrays or point sensors, moving point or line sensors, box flux estimation, plume imaging, long path sensing, and tiered approaches integrating multiple systems. Depending on the target sites and stakeholder goals, several of these approaches may be able to successfully meet primary performance criteria even though they differ in other metrics such as methane concentration detection limit. Although it is beyond the scope of this document to provide detailed protocols for evaluating the full diversity of technologies and applications, this section provides guidelines and principles to follow for assessing innovative leak detection systems that will help stakeholders design and implement protocols for evaluating the ability of systems to meet desired goals.
5.1 Defining System Objectives and Metrics
The next few sections will illustrate and define initial system objectives and metrics.
5.1.1 Clarify system objectives
Successful evaluation of leak detection systems is dependent on a clear understanding of the desired system goals. Prior to designing an evaluation protocol, stakeholders should agree on the system’s primary objectives. Ideally, the objectives should be agnostic to system technology and platform to expand the number and type of potentially successful systems. The following list of questions and example answers can help guide the definition of system objectives. This list is not intended to be exhaustive but provides a starting point for stakeholders.
5.1.1.1 What is the ultimate objective of the leak detection system?
It is important for stakeholders to address the primary goals that they hope to achieve by implementing leak detection systems. There are two primary objectives: detect a leak and respond and quantify an emission rate for mitigation benefit. Detailed examples include:
- Detect methane concentration above a specific concentration limit or difference from baseline concentration
- Detect the presence of emission sources above a specific emission rate
- Quantify the emission rate of a site and/or individual sources
- Locate fugitive emission sources at a site/sub-site level to increase the efficiency of follow-up, component-level surveys such as optical gas imaging (OGI)
- Locate fugitive emission sources at a spatial resolution allowing direct identification of the leaking component
- Survey an area for high emitting sources
- Assess if emission reductions achieve a percentage target
- Assess if emission reductions are equivalent to another technology
- Achieve compliance with a specific regulation or voluntary program
5.1.1.2 What is the typical size and complexity of target sites?
Will use of the system be limited to upstream or midstream facilities? Is it intended for small, relatively simple sites such as single well pads or large, complex sites such as processing plants? Do these sites have access to grid power and/or communications infrastructure such as cellular towers? Example oil and gas (O&G) facility types are listed below.
- Well pads
- Gathering compressor stations
- Processing plants
- A field of upstream and midstream oil and gas sites
- Gathering pipelines
5.1.1.3 What is the spatial distribution of target sites?
Many leak detection systems work at different temporal and spatial scales – some are more suited to finding small leaks at a single facility, while others are intended to quickly find high emission rate sites over a large area. The relative value of these approaches depends on the spatial distribution of the target sites. Some spatial distributions include:
- Single facility
- Cluster of closely-spaced sites
- Widespread, loosely distributed sites
- Linear (e.g., pipeline leaks)
5.1.1.4 What environmental and meteorological challenges apply?
After deciding in which regions the system will be used, one must determine what environmental and meteorological conditions may cause challenges for leak detection systems. For example, some sensors may fail or have decreased accuracy if ambient temperature falls outside an optimal range. Systems that rely on atmospheric dispersion modeling may perform poorly if high wind speed, complex structure, or rough topography causes dispersion to deviate from Gaussian assumptions. Offsite methane sources such as landfills can complicate the ability of systems to determine when elevated concentrations indicate onsite emissions. Examples of environmental and meteorological challenges are listed below.
- Minimum and maximum temperature
- Typical wind speed and direction
- Topography
- Vegetation structure (e.g., forested or grassland)
- Extreme weather (e.g., blizzards, dust storms)
- Other local methane sources (e.g., landfills, cattle)
5.1.1.5 Who will maintain the equipment and how often are site visits required?
Systems vary in their required level of maintenance. Determine who will visit sites to maintain equipment and how often sites can be cost-effectively visited by asking questions such as:
- Will the site operator, regulator, or a third party maintain the equipment?
- For systems located permanently at a site, do system objectives include a maximum frequency of site visits for maintenance or related activities such as instrument calibration?
5.1.1.6 Who will receive data from the system and what are their requirements?
There are many possible approaches for handling data from leak detection systems, such as sending data to operators who record information for later regulatory review, or direct monitoring by regulators. Stakeholders should determine if they have specific data requirements such as a minimum reporting frequency indicating the presence or absence of leaks. They should also carefully assess what data quality issues most affect the primary objectives. For example, a system with a primary objective of identifying large leaks for follow-up surveys likely will fail objectives if a high number of false positives triggers frequent inspection of low emission sites. Consider asking questions like:
- Will the site operator, regulator, or a third party receive data from the systems?
- How frequently does data need to be received?
- What communication infrastructure is required to transmit data?
- What is the tolerance towards false positives, false negatives, or other inaccurate data?
5.1.1.7 Does the system need to be specific to methane and/or measure other compounds?
Oil and gas emissions are comprised of a mixture of hydrocarbons including methane, ethane, and volatile organic compounds (VOCs). Biogenic methane from landfills, cattle, manure, wetlands and waste water treatment have higher levels of ethane than thermogenic natural gas. Isotopes can also be used to distinguish biogenic from thermogenic methane. Does the leak detection system objective refer specifically to methane and what type (thermogenic vs. biogenic) or other species such as natural gas, VOCs, or total hydrocarbons? If the composition of emissions at target sites has low variability, then measuring one compound may be a suitable surrogate for estimating other compounds. If the objective includes distinguishing emission sources with distinct composition (e.g., natural gas versus landfill or produced gas versus tank flashing), then measuring multiple hydrocarbon compounds or the stable isotopic composition of methane may be used to determine the source of emissions. Some compounds to consider include:
- Natural gas
- Methane only
- Ethane
- Isotopically-distinct methane (13C:12C or 2H:1H ratio)
- Total hydrocarbons
- VOCs
- Speciate individual compounds
5.1.1.8 Are there cost objectives mandatory for successful system performance?
A successful system may be required to meet cost effectiveness metrics such as cost per site or cost per methane reduced per site limit if it will be considered suitable for widespread deployment.
The system cost depends on the objectives. For example, a different system or deployment may be chosen to achieve desired levels of spatial and temporal coverage (Figure 38).
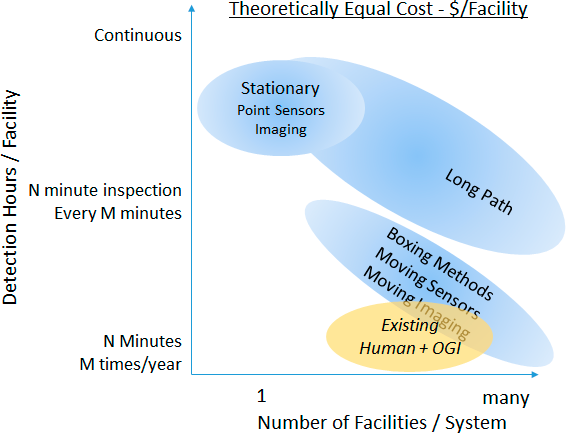
Figure 38. The cost per facility of leak detection systems depends on both the temporal and spatial scales of detection.
Source: Colorado State University.
5.1.1.9 Are there any regulatory requirements or barriers?
Are there any federal, state/provincial, or local regulations that mandate or prohibit specific performance criteria or technologies for the system? For example, regulatory requirements to measure both methane and VOC emissions may rule out the use of sensors that are specific to methane. A regulation may also establish specific performance criteria for alternative technologies, such as the New Source Performance Standards (NSPS) OOOOa Alternative Means of Emissions Limitation, which requires systems to achieve equivalent or better annual emission reductions as semi-annual OGI. In these cases, meeting the regulatory requirement may be considered the primary objective of the system.
5.1.2 Define metric types
After addressing stakeholder questions, the primary objective of the leak detection system can be categorized to guide the design of an evaluation protocol. Most objectives can be classified into one of three categories related to the performance defining metric units: concentration, emission source, or emission reductions. The objective should be expressed as a quantifiable, testable metric that describes the primary goals, target sites, and acceptable limitations of the system. The statement should include sufficient detail so that any system that agrees with the full statement is considered compliant with the objectives. We provide example metrics for each of the three categories.
1. Concentration
The system objective is to assess the value or rate of change of methane concentration (or related pollutants like VOC). Concentration objectives are the simplest category since concentration can be directly measured independent of meteorology or dispersion assumptions. In most situations, concentration objectives will not be appropriate for detecting or quantifying emissions because the downwind concentration at a point will vary with wind direction, wind speed, and atmospheric mixing (stability class).
Example: The system will signal when fence line methane concentrations exceed an actionable level. The system must have a 95% probability of signaling within 4 hours of elevated concentration during precipitation-free conditions of -20 to 120 ⁰F and <10 mph wind speed.
2. Emission source
The system objective is to detect, locate, and/or quantify individual emission sources (or aggregate site-level emissions). This category is more complex because emission rate detection limits typically are highly sensitive to variable environmental parameters such as wind speed. Additionally, systems may depend on assumptions such as Gaussian dispersion that are violated in some field conditions. This category does not require knowledge about the distribution or behavior of sources in the target site population since performance can be defined at the individual source level.
Example: The system will detect, locate, and quantify emission sources at well pads in North Dakota. Emission sources ≥ 6 SCFH must be located within 1-meter spatial accuracy and their emission rate quantified to ±30% within 24 hours. Sources should be identified as intentional, unintentional, or offsite with less than a 5% error of misclassifying intentional or offsite sources as onsite, unintentional. The system must perform successfully 80% of the annual hours with a maximum of 1 week to detect emissions.
3. Emission reductions
The system objective is to reduce emissions by a certain percentage, magnitude, or equivalent amount as another technology. In addition to the issues related to emission sources, this category has the additional complexity of requiring knowledge about the distribution and behavior of emission sources. For example, if a system can detect emission sources above a set emission rate, then site leak rate distributions are needed to calculate what percentage of total emissions would be detected by the system. Since site leak profiles can be highly variable, evaluation of this category may require modeling to calculate the probability of achieving different levels of emission reductions at individual or groups of sites.
Example: The system will achieve equivalent or better emission reductions at gathering stations than quarterly OGI following NSPS OOOOa work practices. Equivalency is defined as percent of annual emission mitigated at the company/basin-level. In addition to the system’s ability to detect leaks, it must be evaluated as part of a work practice that includes the emissions threshold and time to repair detected leaks.
5.1.2.1 Equivalency
Regulations sometimes mandate the use of a specific technology for environmental compliance. In order to promote innovation, these regulations may include a process for permitting the use of alternative technologies. Typically, operators or technology developers are required to submit data that prove the alternative technology is equivalent or better than the default technology at achieving target metrics such as detecting leaks of a certain emission rate or reducing site-level emissions. Equivalency determinations can be classified into two groups: 1) equivalent assessment of individual emission sources, and 2) equivalent reduction of aggregate emissions.
For the first group, which can be included in the concentration or emission source category, an alternative technology must demonstrate equivalent detection, quantification, or localization of individual emission sources of a similar type, concentration, emission rate, and/or gas composition. An example of this type of equivalency is the USEPA NSPS OOOOa definition of OGI (40 CFR §60.5397a(c)(7)(i)(B)), which specifies that OGI equipment “must be capable of imaging a gas that is half methane, half propane at a concentration of 10,000 ppm at a flow rate of ≤60g/hr from a quarter inch diameter orifice” (USEPA 2015c). This determination is an assessment of a technology’s ability to detect emissions from a well-defined source that can be evaluated with a controlled release under laboratory or field conditions.
For the second category, an alternative technology must demonstrate equivalent emission reductions at a specific spatiotemporal scale such as a site’s annual emissions. This is a much more complex determination because a technology’s minimum detection limit and response time affect its ability to reduce emissions (Figure 39). Since many sites have highly skewed emission rate distributions, a technology that quickly detects large emission sources may lead to more reductions than a technology that slowly detects all emission sources. An example used a Monte Carlo approach to simulate component emissions at a processing plant and assessed resulting emission reductions from the Method 21 and OGI (Epperson et al. 2007). The model demonstrated that OGI resulted in equivalent or better site-level emission reductions due to its ability to more quickly detect and mitigate large emitters than the current work practice of Method 21. In response, USEPA revised their regulations to allow use of OGI as an alternative work practice to Method 21.
USEPA NSPS OOOOa requires OGI to be used for leak detection and repair at oil and gas well pads (semi-annually) and compressor stations (quarterly). The rule includes a provision for other technologies to be used as an alternative means of emissions limitation (AMEL) if they achieve at least equivalent emission reductions of greenhouse gas (GHG) and VOC emissions as OGI. The AMEL application process is outlined in 40 CFR §60.5398a with several submission requirements including descriptions of the technology and procedure and 12 months of data demonstrating equivalent reductions at the affected facility (USEPA 2015a). Currently, the regulatory language includes ambiguity and USEPA has not yet provided guidance on the specific data or procedures necessary for a successful application. Outstanding questions include the definition of an affected facility and the use of modeling versus empirical data.
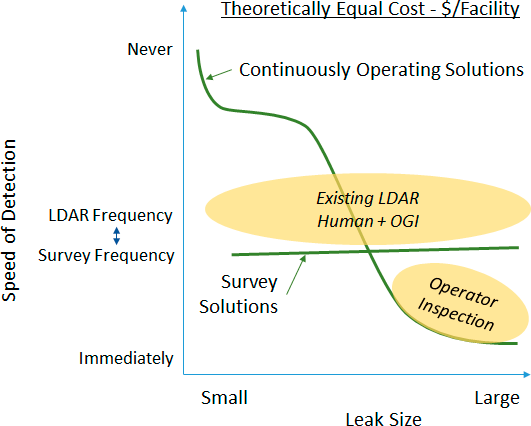
Figure 39. Potential emission reductions are dependent on the relationship of the detection limit and response time of detection systems.
Source: Colorado State University.
5.2 Design elements
Following the expression of system objectives as a statement with testable metrics, stakeholders should consider potential evaluation protocols for assessing these metrics. Each category has a different set of general approaches that can be used to evaluate system objectives:
- Measuring concentrations
- Laboratory testing
For objectives related to measuring concentration, systems can be tested under controlled laboratory conditions to assess performance criteria such as minimum detection limit, precision, response time, interference from other compounds, and the effect of conditions such as temperature and humidity. Laboratory testing has the advantage of being relatively low cost and better able to test defined conditions such as specific ambient temperature.
-
- Field testing
Although laboratory testing is well suited for assessing concentration-based goals, it may be insufficient for assessing system performance under real world conditions compared to field testing. Additionally, field testing can be used to assess the robustness of a system to sustain long-term exposure to outdoor conditions.
-
- Example: Methane Detectors Challenge Summary
The Methane Detectors Challenge is a partnership between Environmental Defense Fund, O&G operators, and technology developers to evaluate continuous leak detection systems with a combination of laboratory and field testing.
-
- Example: USEPA NSPS OOOOa OGI Definition
USEPA regulation OOOOa includes a definition of OGI that can be evaluated with controlled releases under laboratory or field conditions.
- Detect and quantify emission sources
- Laboratory testing
Emission source-based objectives are difficult to assess in the laboratory because most leak detection systems rely on complex analyses of concentration and meteorological data to detect, quantify, and/or locate emissions. It is possible to perform controlled releases in a laboratory setting, but satisfactory performance under controlled conditions does not indicate that the system will succeed under sub-optimal conditions. Due to the difficulty in replicating complex, diverse atmospheric conditions, laboratory testing is insufficient for assessing how a system will perform in the field.
Laboratory testing may be useful for screening systems with emission source objectives when there are limited resources for follow-up field testing. In particular, early stage technologies that are unable to meet concentration-based metrics will likely have issues quantifying emission rates. Initial screening can be used to eliminate any systems that do not meet underlying concentration metrics, but care should be taken that the metrics are not arbitrary and allow for innovative approaches to analyze low quality data.
-
- Field-based controlled releases
Controlled releases under field conditions are ideal for systems with emission source objectives because they can assess the accuracy of source quantification and/or localization under realistic meteorological conditions. Ideally, field testing should use controlled releases that are of similar emission rates and release points as targeted sources. Long-term testing at field sites allows controlled releases to be tested under a diversity of meteorological conditions. Performing multiple controlled releases under each set of conditions can be used to calculate the probability of detection as a function of emission rates and other relevant conditions such as wind speed.
In this example, the detection probability and emission reductions of OGI were evaluated under different conditions.
-
- Field trial
Compared to field-based controlled releases, a field trial at O&G facilities has the advantage of incorporating realistic conditions including the human element of leak detection and repair into the evaluation process. Field trials can include controlled releases by intentionally releasing emissions from O&G equipment.
The Methane Emissions Technology Evaluation Center is a field test site that uses controlled releases simulating natural gas operations to evaluate leak detection systems.
- Quantifying Emission Reductions
- Field-based controlled releases and field trials
For emission reduction objectives, field-based controlled releases and field trials can be used to determine the probability of detection functions. Although these data are not sufficient for assessing emission reductions, an accurate understanding of the probability of detection is necessary for estimating emission reductions.
-
- Modeling
Computer modeling is highly valuable for evaluating emission reduction objectives due to the probabilistic nature of emission rates (Figure 40). Several studies have demonstrated that O&G sites have highly skewed emission rate distributions with the top 5% of sites responsible for about 50% of total emissions. These high emission sites, sometimes known as super emitters, may have malfunctions or abnormal process conditions that can be mitigated to reduce emissions. The occurrence of high emitting sources is primarily stochastic and therefore frequent monitoring is needed to identify these sites. Due to the skewed distribution rate, an application that quickly detects high emitters may achieve greater emission reductions at the population level than an application with a lower detection limit and slower response time. However, at the individual site level, a high emission screening approach (with poorer minimum detection thresholds) could result in lower emission reductions at the majority of sites with relatively low emissions, but much greater reductions at high emission sites. Therefore, the demonstration of equivalent reductions is complicated by the variability in site emission rates if “affected facility” must be interpreted as a single site such as a well pad. Alternatively, an affected facility could be defined as an aggregation of individual sites such as all of an operator’s well pads in a basin. Another approach could be to define an affected facility as a probabilistic model site, which uses the emission rate distribution of a population site to represent a single site with a probability distribution function of emission rates. This approach would allow emission reductions to be calculated as a probability function with a successful determination of equivalency based on a metric such as a 95% probability of equal or greater emission reductions than the reference approach.
The efficacy of applications for leak detection, quantification, and localization is impacted by meteorological conditions and site configurations. This includes the emission reduction potential of OGI, which physics-based modeling has shown to be dependent on parameters such as view distance and emissivity, some of which are not defined in NSPS OOOOa leak detection protocols. The immense diversity of conditions under which an application can be implemented precludes an empirical evaluation of all possible scenarios. Computer-based modeling, coupled with empirical validation of model accuracy, is a potential solution to rigorously evaluate application efficacy under the most likely encountered meteorological and site conditions. There are several recent examples of modeling used to evaluate sensor performance. A Gaussian dispersion model used 10 years of local, hourly meteorological data to predict the median hours to detection of potential emission sources at three model sites with different layouts of point and open-path methane analyzers (Kemp, Ravikumar, and Brandt 2016). The Fugitive Emissions Abatement Simulation Toolkit (FEAST) model is a virtual gas field simulator that predicts emission reductions of various leak detection and repair programs. An effective demonstration of equivalency could include an empirical evaluation of an application at a structurally complex site such as a gathering compressor station over a time period such as 12 months that assesses performance under a wide range of meteorological conditions. If a computer model can accurately predict the detection limit and response time for different sources as a function of environmental parameters, then a probabilistic model can be used to simulate the performance at other sites. This approach could allow a scientifically rigorous determination of equivalency while minimizing the number of sites required for field testing.
-
- Example: FEAST MODEL
In this example, a model was developed to estimate field-level emission reductions of different LDAR technologies and programs.
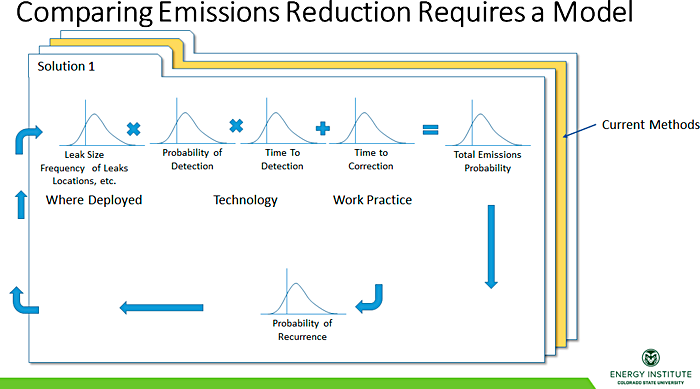
Figure 40. System objectives based on emission reductions requires a model incorporating the probability and time to detection with data on leak populations and repair protocols.
Source: Colorado State University.
-
- Side-by-Side Testing
Controlled Statistical Field Survey Method
The intention of Controlled Statistical Field Survey method testing is to conduct sufficient system level performance testing of the technology to confirm that the system in whole meets the requirements of the end user, regulations, and the market place. It specifically compares the performance of one technology against another technology, typically a technology that is a generally accepted practice.
This survey method is intended to establish the performance characteristics of a new method or technology against established Method 21 or OGI leak survey methods.
These definitions are relevant to the following discussion:
Minimal Detectable Leak (MDL): A leak with environmental conditions or gas plume characteristics that an instrument has a 50% probability of detecting when used in normal operation mode.
Minimal Actionable Leak (MAL): A large enough leak that meets specific guidelines, levels, or conditions that require it to be repaired.
Non-detectable Leak: A leak with environmental conditions or gas plume characteristics that an instrument is not able to detect.
Technology under Test (TUT): A new technology that is being tested to determine if it meets performance requirements.
Baseline Technology (BT): An existing technology that is already in use, generally accepted, and validated for use in the application.
Single-Blind Survey: A leak survey conducted using actual known leaks. The TUT is blind to the location of the known leaks. Known leaks are acquired by previous surveys and have not been repaired.
Double-Blind Survey: A leak survey conducted without a prior knowledge of leak locations. Both the TUT and BT survey independently of each other, but within the same time and distance constraints.
Controlled Statistical Field Survey testing ensures that the TUT meets the requirements of the intended use and user requirements. The Blind Survey validation method compares statistical leak detection performance of the TUT to the performance of the BT under actual field conditions. Single-blind and double-blind methods are used to collect independent data samples, which aid in identifying performance differences based on the technology and operator use of the technology.
Characteristics that need to be profiled include items such as the practical minimal detection ability, survey technique, statistical comparison, unit-to-unit repeatability, and user-to-user repeatability.
The following statistical data will be derived:
- Overall detection statistics. A minimum of 100 leaks, single-blind survey method. Determine the following statistical values for both the TUT:
- Percentage of leaks found
- Percentage of missed leaks
- Percentage of leaks not detectable
- Percentage of false alarms
- Overall detection statistics. A minimum of 100 leaks, double-blind survey method. Determine the following statistical values for both the TUT and BT:
- Percentage of leaks found
- Percentage of missed leaks
- Percentage of leaks not detectable
- Percentage of false alarms
- Minimal Detectable Leak Characterization. A minimum of 50 leaks. Determine the environmental conditions, distance from leak, leak plume volume, leak plume gas concentration that creates a probability of 50% or less of detecting the leak. Determine the following statistical values for both the TUT and BT:
- Gas plume concentration
- Variability of gas release (e.g., constant, intermittent)
- Conditions that limit the effectiveness of the TUT compared to the BT
Field trials would be closely monitored to maintain consistency in the data collection and statistical analysis. Specific field trial profiles would be established and conducted to obtain the appropriate statistical data.
In the single-blind survey method, the TUT would be blind as to knowledge of leak locations.
It is anticipated that the BT operator and observers may have a priori of leak locations so that TUT performance can be observed.
In the double-blind survey method, the TUT and BT observers would be blind to the location of actual leaks. Concurrent surveys would be conducted over a period of time using both TUT and BT under normal/routine surveys.
Single-survey procedure:
The following procedure can be used for the gathering of statistical performance data of the TUT.
-
- The survey team will consist of two people: TUT operator and BT operator.
- The TUT operator will be in the lead while surveying, followed immediately by the BT operator.
- The BT operator will survey the same area as the TUT operator.
- The normal survey method for the technology should be used. Attempts should be made to survey as normal.
- If the TUT operator misses a leak that is detected by the BT, then the TUT operator will re-scan the leak location. Note, the operator should re-scan as normal, and then slower or at different angles/distance until detecting the gas or until a determination is made that the leak is not detectable.
- If the BT operator misses a leak that was detected by the TUT, then the BT operator will re-scan the leak location. Note, the operator should re-survey as normal, and then slow down and probe more thoroughly until detecting the gas or until a determination is made that the leak is not detectable.
- Document the leak in the leak survey database.
Double-survey procedure:
The following procedure can be used for the gathering of statistical performance data of the TUT compared to the BT. This method should be used with multiple instruments and operators to factor in the variance of use and instrument repeatability.
This survey method is intended to give a more independent measure of performance in conditions of less control relative to the single-blind method. It is recognized that this testing may continue for some length of time over differing conditions, users, and instruments. Consequently, the data collection may be less consistent and therefore more difficult to statistically analyze.
-
- The survey team will consist of two people: TUT operator and BT operator.
- The TUT operator will be in the lead while surveying, followed independently by the BT operator. Enough time and distance separation are required to eliminate the chance that one operator may observe another, while being short enough to make sure both have the same opportunity to observe the leak.
- The BT operator will survey the same area as the TUT operator.
- The normal survey method for the technology should be used. Attempts should be made to survey as normal.
- Once a specified area is completed, both operators will compare leaks found.
- If the TUT operator misses a leak that is detected by the BT, then the TUT operator will re-scan the leak location. Note, the operator should re-scan as normal, and then slower or at different angles/distance until detecting the gas or until a determination is made that the leak is not detectable.
- If the BT operator misses a leak that was detected by the TUT, then the BT operator will re-scan the leak location. Note, the operator should re-survey as normal, and then slow down and probe more thoroughly until detecting the gas or until a determination is made that the leak is not detectable.
- Document the leak in the leak survey database.
5.3 Data Quality Objectives and Monitoring, Reporting, and Recordkeeping
Regulatory agencies may have data quality objectives and monitoring, reporting, and recordkeeping requirements related to the evaluation of innovative leak detection systems. Additional information on this topic may be provided if agencies clarify the regulatory requirements.
5.4 Conclusion
Innovative methane detection and quantification technologies should be evaluated with a technology-neutral process that clearly defines the objectives of the system with testable metrics. Objectives can be based on concentration, emission sources, or emission reductions. Other objectives may include equivalency to other technologies and work practices, which also can be defined at the concentration, source, or reduction level. For many technologies, emission source detection limit and response time is a complex function of many parameters such as wind direction that can be determined with empirical testing and/or physics-based modeling (Figure 41). For reduction-based objectives, computer modeling can be used to predict emission reductions at the site or population level based on the technology’s probability of detection and parameters related to emission mitigation work practices (Figure 42). A combination of scientifically rigorous empirical testing and modeling can fairly assess the ability of diverse technologies and approaches to meet stakeholder objectives.
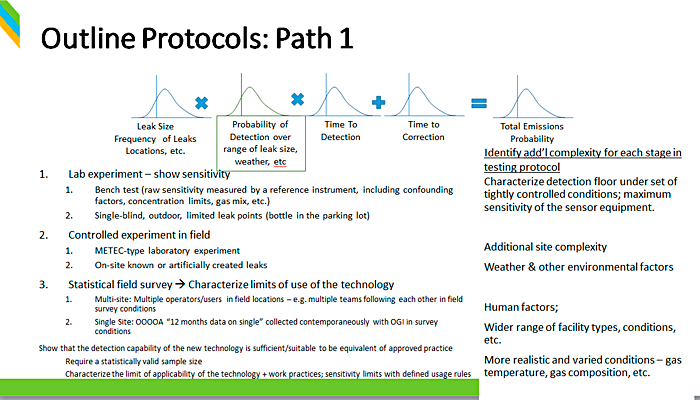
Figure 41. A conceptual model for evaluating source-based system objectives.
Source: Colorado State University.
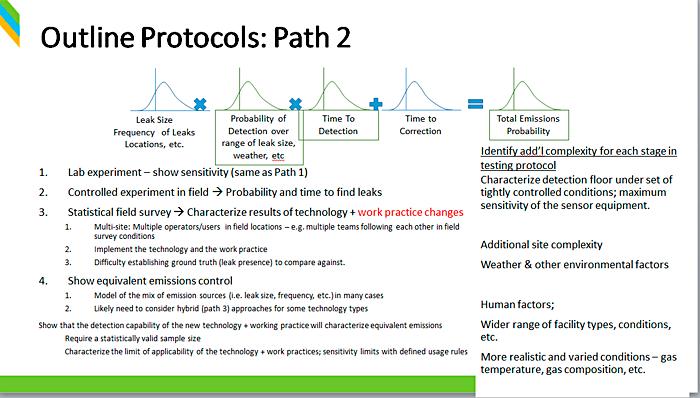
Figure 42. A conceptual model for evaluating reduction-based system objectives.
Source: Colorado State University.
Publication Date: September 28, 2018

