4.2 Technologies
This section includes an overview table of current and emerging technologies using the classifications presented in Section 4.1.2 followed by more detailed descriptions of each technology. Section 4.3 then discusses different applications for the technologies.
4.2.1 Current Technology Overview
Table 5 below can be used to compare the known methane detection and quantification technologies.
Table 5. Summarizing examples of technology/applications.
Source: ITRC Methane Team.
View Table 5 in Adobe PDF format.
4.2.2 Technology Descriptions
4.2.2.1 Pellistor (Catalytic Bead) ▼Read more
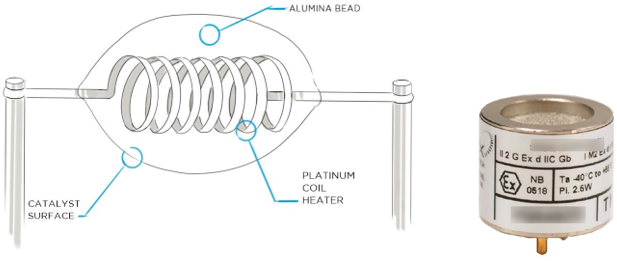
Figure 3. Drawing and illustration of an element.
Source: Heath Consultants.
Characteristics: Pellistor (Catalytic Bead)
- Primary Data Type: quantitative
- Result Type: quantitative (concentration)
- Detection Range (low to high): 500 ppm-5%
- Specificity to Methane/ Interference: nonspecific/high
- Other Benefits: low cost, widely used, or readily available
- Measurement Temporal Resolution: seconds
- Size: small
- Typical Deployment Method: walking, fixed
- Environmental Limitations: humidity, temperature, contaminants
- Calibration Procedure: calibration gas; weeks to months
- Maturity: mature
- Miscellaneous: Sensors have a short life depending on level of contaminants it is exposed to. Sensors may be damaged by shock or vibration. Loss of sensitivity when exposed to organic materials. Exposure to high gas concentrations may reduce sensor life.
Mode of Use:
Suitable for leak detection of VOCs and hydrocarbons. It is non-selective to the gas species and typically used as a portable gas detection instrument or in fixed monitor applications. This sensor technology is most often used in combustible gas indicators and personal protection devices for the measurement of explosive levels of gas.
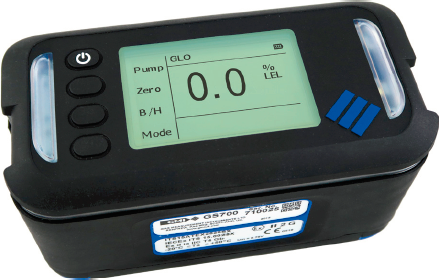
Figure 4. Example of a portable combustible gas indicator.
Source: GMI.
4.2.2.2 Metal Oxide Semi-conductor (MOS) ▼Read more
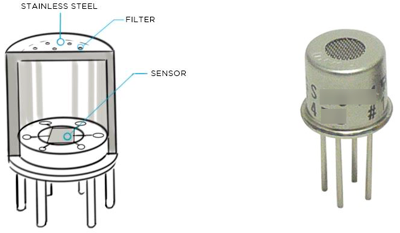
Figure 5. MOS sensor element.
Source: Heath Consultants.
Characteristics: Metal Oxide Semi-conductor (MOS)
- Primary Data Type: quantitative
- Result Type: quantitative (concentration)
- Detection Range (low to high): 50 ppm – 1%
- Specificity to Methane/ Interference: nonspecific/high
- Other Benefits: low cost, widely used, readily available
- Measurement Temporal Resolution: seconds
- Size: small
- Typical Deployment Method: walking, fixed
- Environmental Limitations: humidity, temperature, contaminants
- Calibration Procedure: calibration gas; frequent calibration required and self-zeroing
- Maturity: mature
- Miscellaneous: MOS sensors will react to a wide range of different gases. Often false readings are experienced by rapid change in the ambient air (e.g., moisture and temperature). Exposure to high gas concentrations may de-sensitize the sensor lasting for a prolonged period or may have irreversible change to its zero-gas reading or sensitivity. Exposure to basic or acidic compounds, silicones, sulfur, and halogenated compounds may have a significant irreversible effect on sensitivity. High oxygen concentrations may have a significant irreversible effect on sensitivity
Mode of Use:
MOS is suitable for leak detection of VOCs and hydrocarbons. It is non-selective to the gas species and is highly responsive to other gases. Typically, the technology is used as a portable gas detection instrument. This sensor technology is most often used for applications which do not require very high sensitivity and do not have high gas concentrations. Often the sensor is used to “sniff” around fittings.
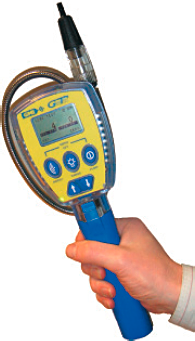
Figure 6. Portable gas indicator with MOS sensor tip.
Source: GMI.
4.2.2.3 Flame Ionization Detector (FID) ▼Read more
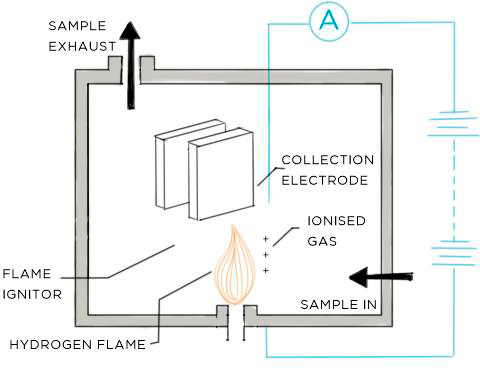
Figure 7. FID cell.
Source: Heath Consultant.
Characteristics: Flame Ionization Detector (FID)
- Primary Data Type: quantitative
- Result Type: quantitative (concentration)
- Detection Range (low to high): 5 ppm (low)
- Specificity to Methane/ Interference: nonspecific/high
- Other Benefits: widely used, readily available
- Measurement Temporal Resolution: seconds
- Size: handheld
- Typical Deployment Method: walking, fixed
- Environmental Limitations: humidity, temperature, contaminants
- Calibration Procedure: calibration gas; frequent calibration is required with a field calibration kit. Upon power, sensor must zero on the ambient air condition.
- Maturity: mature
- Miscellaneous: FID is not suitable for detection of carbon monoxide and inorganic gases. High gas concentrations will cause a flame out. Halogenated hydrocarbons reduce the sensor response and will affect the measurement of the total hydrocarbon concentration.
Mode of Use:
FID is suitable for leak detection of VOCs and hydrocarbons. It is non-selective to the gas species. Typically, the technology is used as a portable gas detection instrument. Instruments require the use of hydrogen fuel carried in small DOT-compliant cylinders. Typically, the hydrogen fuel cylinders are restricted from being transported on airplanes and tunnels.
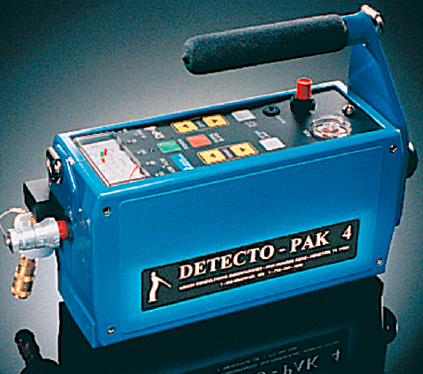
Figure 8. FID gas leak survey instrument.
Source: Heath Consultants.
4.2.2.4 Gas Chromatography (GC) ▼Read more
As gas passes through the separator column, the gas components will separate from each other based on their molecular weight (MW), since higher MW gases take longer to pass through the column. As the gas exits the separator and passes through the detector, a signal versus time trace is created. The timing of the various peaks will indicate the type of gas. The gas concentration required to make measurements vary significantly based on the instrument design. Highly sensitive systems are typically found in laboratory instruments. Portable instruments typically require higher gas concentration. Response rate is slow and varies based on the design of the separator.

Figure 9. Example gas transport and column separator. Gases of different weight transport through the column at different speeds.
Source: Heath Consultants.
Characteristics: Gas Chromatography (GC)
- Primary Data Type: quantitative
- Result Type: quantitative (concentration)
- Detection Range (low to high): ppb to %
- Specificity to Methane/ Interference: specific/low
- Other Benefits: high specificity; used to detect large variety of other compounds
- Measurement Temporal Resolution: More than 3 minutes
- Size: large
- Typical Deployment Method: fixed
- Environmental Limitations: requires controlled environment
- Calibration Procedure: calibration gas; daily to monthly. Typically, a calibration check and purge is required prior to use. Calibration frequency varies based on the instrument design.
- Maturity: mature
- Miscellaneous: clean, dry carrier gas is typically required
Mode of Use:
Both portable and fixed systems are commercially available. Portable instruments are often used to identify the possible gas source. For example, natural gas will contain a percentage of ethane. Therefore, to determine if an underground gas leak is from a natural gas pipeline or from a biological source, a portable GC is used to determine if ethane is present.
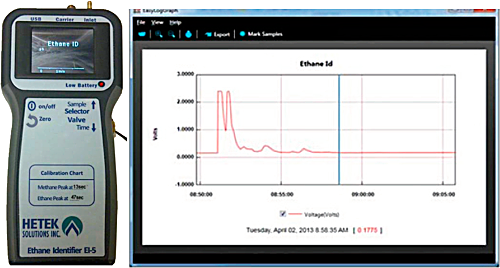
Figure 10. Example of a portable ethane identifier for discriminating natural gas containing ethane.
Source: Hetek supplied by Heath Consultants.
4.2.2.5 High Volume Dilution Sampling ▼Read more
Characteristics: High Volume Dilution Sampling
- Primary Data Type: quantitative
- Result Type: quantitative (emission rate)
- Detection Range (low to high): 1.4 – 226 SLPM (standard liters per minute)
- Specificity to Methane/ Interference: depends on sensor
- Other Benefits: unknown
- Measurement Temporal Resolution: seconds
- Size: handheld
- Typical Deployment Method: walking
- Environmental Limitations: depends on sensor
- Calibration Procedure: calibration gas; daily (depends on sensor)
- Maturity: mature
- Miscellaneous: no longer manufactured; calibration procedures are very important
Mode of Use:
The leak rate measurement is conducted by placing the instrument hose inlet in a manner that captures the emission source being sampled, with the concept being that the instrument draws in enough excess air to capture the entire leak. Compared to other concentration sampling devices that simply measure concentration in a very small sample of air, the instrument draws in a very large flow rate of air (between 5 and 10.5 cfm for the high volume dilution sampler), with the result that the device can calculate an emission rate from the known air flow and the measured concentration. This approach does assume that the entire emission rate is captured, which can be tested by allowing the device to pull in less air and check to see that it still calculates the same emission rate.
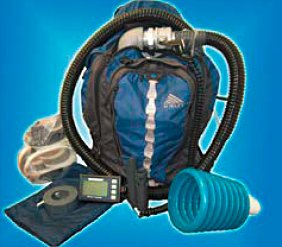
Figure 11. Example of a high volume flow sampler.
Source: Heath Consultants.
4.2.2.6 Mass Spectrometry ▼Read more
All mass spectrometers measure the mass-to-charge ratio (m/z) of an analyte. There are a variety of approaches used to determine mass-to-charge ratio including quadrupole mass analyzer, ion traps, and time-of-flight mass analyzers. These systems use a multitude of ionization sources, such as electron impact (EI), chemical ionization (CI), and electrospray ionization (ESI), to produce ions that are detected by the instrument. Mass spectrometry is a relatively mature field with robust instruments in laboratory and field settings.
Characteristics: Mass Spectrometry
- Primary Data Type: quantitative
- Result Type: quantitative (concentration)
- Detection Range (low to high): ppb to %
- Specificity to Methane/Interference: is a function of the resolving power of the system; if auxiliary systems like GC are added, then specificity can be improved.
- Other Benefits: some devices can distinguish thermogenic and biogenic by isotopic determination (C12-C13)
- Measurement Temporal Resolution: 3 minutes when paired with a GC
- Size: handheld to large
- Typical Deployment Method: fixed
- Environmental Limitations: requires controlled environment
- Calibration Procedure: calibration gas; daily to monthly
- Maturity: mature
- Miscellaneous: most often paired with a GC
Mode of Use:
A solid, liquid, or gas sample is ionized (i.e., by bombarding with electrons), then mass analyzed and detected. The m/z ratio is plotted versus its relative abundance producing mass spectrum, see Figure 12.
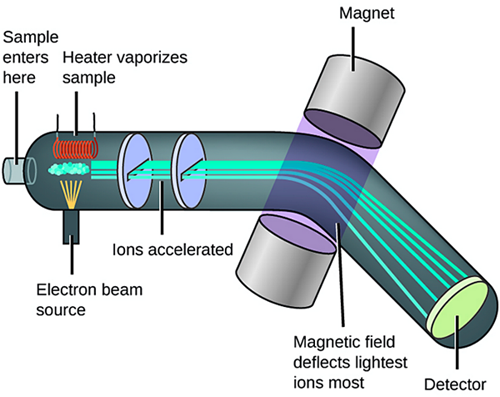
Figure 12. Schematic of mass spectrometer operation.
Source: Openstax.
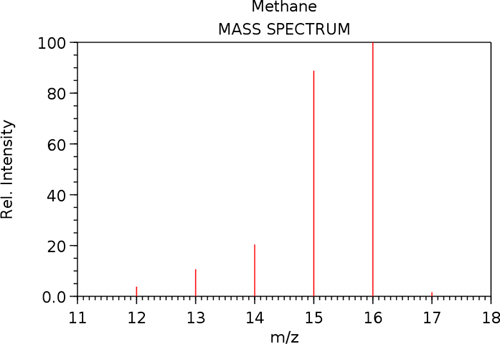
Figure 13. Mass spectrum of methane.
Source: National Institutes of Standards and Technology.
There are several limitations of MS.
- All mass spectrometers require a vacuum system. Some systems require a demanding vacuum system while some newer technologies reportedly use minimal vacuum systems.
- Structural isomers are generally distinguishable while stereoisomers can be difficult to distinguish.
- The EI fragmentation patterns for some classes of hydrocarbons (e.g., n-alkanes) are highly conserved making absolute identification of the molecule difficult. Tandem techniques (e.g., addition of chromatographic systems) are frequently used to characterize complex hydrocarbon samples.
A variety of miniature and field-portable mass spectrometers are currently under development. For example, the coded aperture miniature mass spectrometer environmental sensor (CAMMS-ES) is being developed as a methane monitoring system. This instrument is capable of continuous sampling and has increased specificity and sensitivity for methane detection and other VOCs.
4.2.2.7 Printed Nanotube Sensors ▼Read more
Characteristics: Printed Nanotubes Sensors
- Primary Data Type: quantitative
- Result Type: quantitative (concentration)
- Detection Range (low to high): 5 ppm – unknown
- Specificity to Methane/ Interference: nonspecific/high
- Other Benefits: low power and low voltage
- Measurement Temporal Resolution: minutes
- Size: small
- Typical Deployment Method: fixed
- Environmental Limitations: unknown
- Calibration Procedure: unknown
- Maturity: developing
- Miscellaneous: currently being field tested under DOE ARPA-E MONITOR
Mode of Use:
The sensors can be affixed to a variety of surfaces or attached to poles surrounding operations. As the wind direction shifts, a methane plume will be transported in the direction of the sensor. The sensor will read a change in concentration. A number of these sensors can be distributed across a wellhead, pipeline, compressor station, or other oil and gas operations. Combining the signals may provide information about the source and magnitude of the emission.
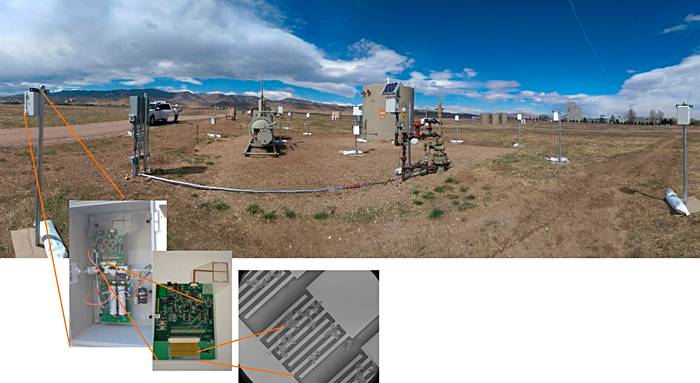
Figure 14. An example of a nanotube sensor.
Source: Provided courtesy of PARC.
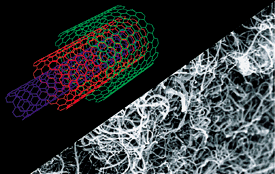
Figure 15. Photo of carbon nanotubes. Produced as tangled bundles, multi-walled nanotubes are concentric layers of cylindrical carbon lattices.
Source: Bayer MaterialScience.
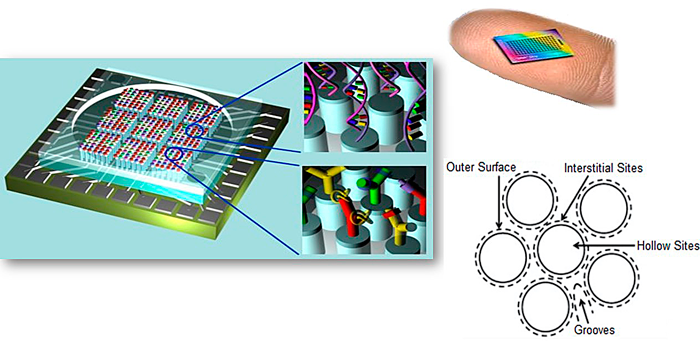
Figure 16. Nanotube sensor.
Source: (Chattopadhyay 2008).
4.2.2.8 Dual Frequency Comb Spectroscopy ▼Read more
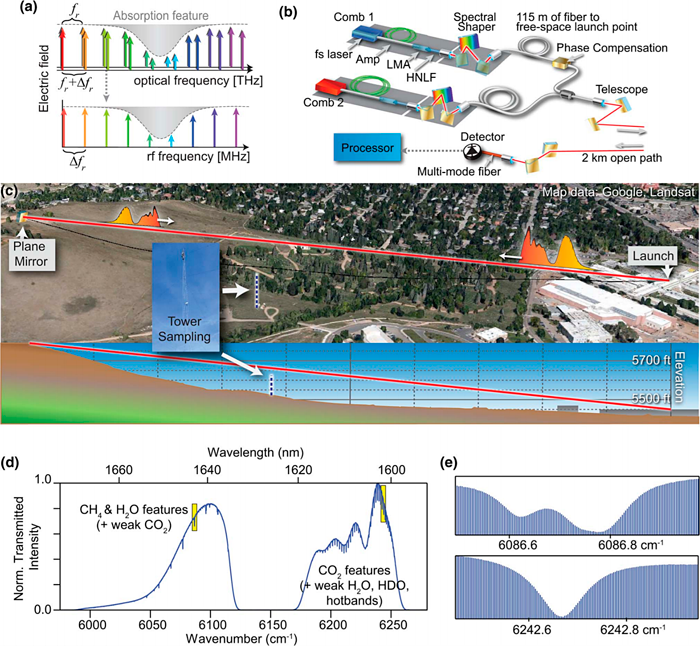
Figure 17. Open-air path greenhouse gas sensing through dual-comb spectroscopy.
Source: (Rieker 2014).
Characteristics: Dual Frequency Comb Spectroscopy
- Primary Data Type: quantitative
- Result Type: quantitative (concentration)
- Detection Range (low to high): 20 ppm-m
- Specificity to Methane/ Interference: specific/low
- Other Benefits: simultaneous detection of other hydrocarbons; can distinguish thermogenic and biogenic
- Measurement Temporal Resolution: depends on deployment; can range from 1-100 minutes
- Size: large
- Typical Deployment Method: fixed
- Environmental Limitations: precipitation reduces signal in path
- Calibration Procedure: reference cell
- Maturity: developing
- Miscellaneous: Currently a research-based field instrument
Mode of Use:
The technology is based on an electrically-pumped semiconductor laser that produces frequency comb integrated into a single few millimeter-long laser diode and emits many highly stable wavelengths at the same time. DCS measurements are partially based on absorption spectroscopy where one frequency comb interacts with the sample e.g. molecules in open air. The frequency and intensity of the transmitted light is specific for the type and concentration of chemical species in the sample. The acquisition of all wavelengths is performed simultaneously by coherent detection by heterodyning with a second frequency comb.
4.2.2.9 Laser Absorption Spectroscopy ▼Read more
The infographic below (Figure 18) shows some common variants of LAS.
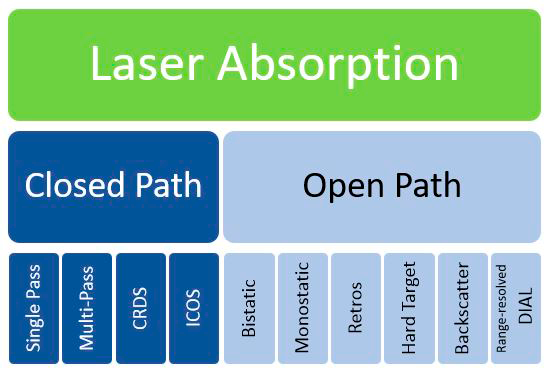
Figure 18. Implementation methods commonly used for laser absorption spectroscopy.
Source: ITRC Methane Team.
4.2.2.10 Laser Absorption Spectroscopy – Closed Path ▼Read more
Single-Pass Tunable Laser Absorption Spectroscopy. This is the simplest mode of laser absorption spectroscopy. In this mode, the laser is directly transmitted through a medium and detected after light absorption. The light absorption is dependent on the concentration of the detected species, which is used to measure the concentration of methane.
Characteristics: Closed Path Single-Pass Tunable Laser Absorption Spectroscopy
- Primary Data Type: quantitative
- Result Type: quantitative (concentration)
- Detection Range (low to high): ppm to %
- Specificity to Methane/ Interference: specific/low
- Other Benefits: can distinguish thermogenic and biogenic
- Measurement Temporal Resolution: millisecond
- Size: large
- Typical Deployment Method: vehicle path and fixed
- Environmental Limitations: none
- Calibration Procedure: calibration cell; some technologies are calibration free
- Maturity: mature
- Miscellaneous: N/A
Mode of Use:
The laser is transmitted through the region of interest. The path-averaged methane concentration values are obtained continuously. The spectrum of methane and possible interferers can be obtained during the design phase and the interference effect can be minimized. The absorption depends on the path length “L” as shown in Figure 19. The calibration process, if it is necessary, uses a static cell of known concentration methane.

Figure 19. Schematic for a basic tunable laser absorption spectroscopy setup.
Source: Provided courtesy of Indrio Technologies.
Multi-pass Tunable Laser Absorption Spectroscopy. In this method, path amplification is achieved by reflection between mirrors. However, the light travels a unique path between the input and output. This makes the sensors uniquely more robust than the other two cavity techniques. However, the path amplification achieved is lower. This leads to a reduced sensitivity depending on the path length.
Characteristics: Multi-pass Tunable Laser Absorption Spectroscopy
- Primary Data Type: quantitative
- Result Type: quantitative (concentration)
- Detection Range (low to high): ppb to %
- Specificity to Methane/ Interference: specific/low
- Other Benefits: can distinguish thermogenic and biogenic
- Measurement Temporal Resolution: millisecond
- Size: handheld, large
- Typical Deployment Method: vehicle path, fixed
- Environmental Limitations: none
- Calibration Procedure: calibration cell; some technologies are calibration free
- Maturity: mature
- Miscellaneous: N/A
Mode of Use:
Similar to the other cavity techniques, the highest resolution spectrum can be achieved because of their insensitivity to laser-wavelength scan rates, enabling reduced cross species interference due to data reduction schemes, such as wavelength modulation spectroscopy.

Figure 20. Schematic for basic multi-pass tunable laser absorption spectroscopy.
Source: Provided courtesy of Indrio Technologies.
Cavity Ring Down Spectroscopy. Cavity Ring Down Spectroscopy (CRDS) is a method where the significantly enhanced path of absorption is obtained by use of an optical setup consisting of two high-reflectivity mirrors. The path enhancement is achieved by trapping the light between two mirrors until a certain level of desired path length amplification is obtained. The basic principle of operation is based on the fact that light bounces back and forth several times between the mirrors until the light is either absorbed or leaks through the high-reflectivity mirrors. The absorption in the cell is quantified from time-resolved “ring-down” signals in the optical cavity with and without the absorbing gas. This magnification factor is directly influenced by the reflectivity of the mirrors. This mirror is therefore prone to sensitivity to environmental factors that may alter the magnification factor.
Characteristics: Cavity Ring Down Spectroscopy
- Primary Data Type: quantitative
- Result Type: quantitative (concentration)
- Detection Range (low to high): ppb to %
- Specificity to Methane/ Interference: specific/moderate
- Other Benefits: some can distinguish thermogenic and biogenic
- Measurement Temporal Resolution: seconds
- Size: large
- Typical Deployment Method: vehicle path, fixed
- Environmental Limitations: requires controlled environment
- Calibration Procedure: calibration gas
- Maturity: mature
- Miscellaneous: moderate interference from water – sample must be dried
Mode of Use:
A typical schematic for a CRDS setup is shown in Figure 21. The high-reflectivity mirrors are used to amplify the detection sensitivity. The effective path of absorption for CRDS is multiplied by a gain factor, G. This results in enhanced sensitivity of methane detection. Typically, an ultra-long path of a kilometer can be achieved. This enables detection of sub-ppm sensitivity and also isotopic characterization, which is useful for source attribution.
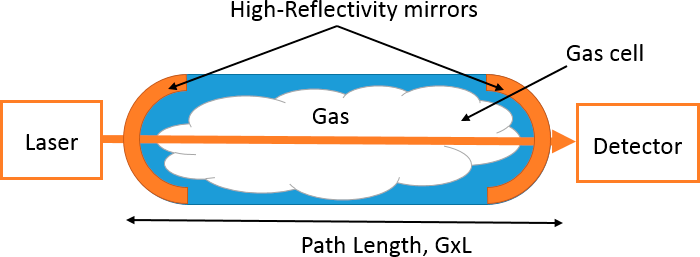
Figure 21. Schematic for a basic CRDS setup.
Source: Provided courtesy of Indrio Technologies.
Integrated Cavity Output Spectroscopy (ICOS). Integrated Cavity Output Spectroscopy (ICOS) is another path amplification technique with high-reflectivity mirrors and more robust noise performance. Instead of using the cavity ring down time, the light is bounced back and forth between the high-reflectivity mirrors as a continuous stream and wavelength is scanned fast enough to avoid cavity resonance noise. This enables scanning of laser wavelength and can be used to resolve spectral shapes of methane and correct for interference to an extent that photons and laser wavelength are scanned fast enough to avoid cavity resonance noise. However, this technique is also susceptible to long term drifts and hence frequent calibration is required.
Characteristics: Integrated Cavity Output Spectroscopy
- Primary Data Type: quantitative
- Result Type: quantitative (concentration)
- Detection Range (low to high): ppb to %
- Specificity to Methane/ Interference: specific/moderate
- Other Benefits: some can distinguish thermogenic and biogenic
- Measurement Temporal Resolution: seconds
- Size: large
- Typical Deployment Method: handheld, vehicle path, fixed
- Environmental Limitations: requires somewhat controlled environment
- Calibration Procedure: calibration gas
- Maturity: mature
- Miscellaneous: moderate interference from water – sample must be dried
Mode of Use:
Very similar to the mode of operation for CRDS.

Figure 22. Schematic for a basic ICOS setup.
Source: Provided courtesy of Indrio Technologies.
4.2.2.11 Laser Absorption Spectroscopy – Open Path ▼Read more
Open path tunable laser absorption spectroscopy techniques are based on the laser path being open to the atmosphere. The path can be either fixed in distance or variable depending on the instrument and mode of operation.
Characteristics: Open Path (Bistatic, Monostatic, Backscatter, Ranged Resolved DIAL)
- Primary Data Type: quantitative
- Result Type: quantitative (concentration)
- Detection Range (low to high): 0.2 ppm-m – 100,000 ppm-m
- Specificity to Methane/ Interference: specific/low
- Other Benefits: highly reliable and durable
- Measurement Temporal Resolution: millisecond
- Size: handheld, large
- Typical Deployment Method: walking, fixed
- Environmental Limitations: precipitation reduces signal in path
- Calibration Procedure: built in calibration cell typical
- Maturity: mature
- Miscellaneous: widely used for gas distribution surveys
Bistatic. In a bistatic open path system, the laser is launched down range to a reflective surface; the reflected light is then angled to a separate receiver. The laser transmitter and receiver are located in two separate fixed locations. In theory, a laser fence can be set up around a facility. In this configuration, precise alignment and highly reflective mirrors (retro-reflectors) are used to obtain a long path length.
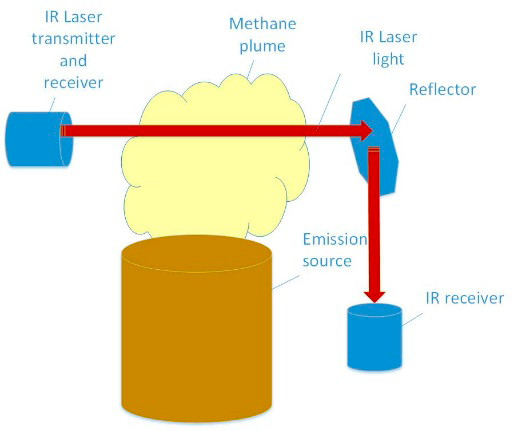
Figure 23. In a bistatic configuration, the laser transmission and receiver are located at two different locations. Often the laser is redirected by a reflector to create a boundary type path.
Source: Heath Consulting.
Monostatic. In a monostatic open path system, the laser is launched down range to a reflective surface; the reflected light then returns to the launch position. The laser transmitter and receiver are located in the same fixed position. The effective path length is doubled, resulting in increased sensitivity. Depending on the desired distance to cover, simple reflective surfaces to highly precise retro-reflectors are used. Monostatic systems are easier and more cost effective to deploy than bistatic systems.
Monostatic designs can be either short or long paths. Short path systems are useful for making point measurement. Long path systems are capable of detecting leaks that may occur along its path or integrating the concentration of a large distance.
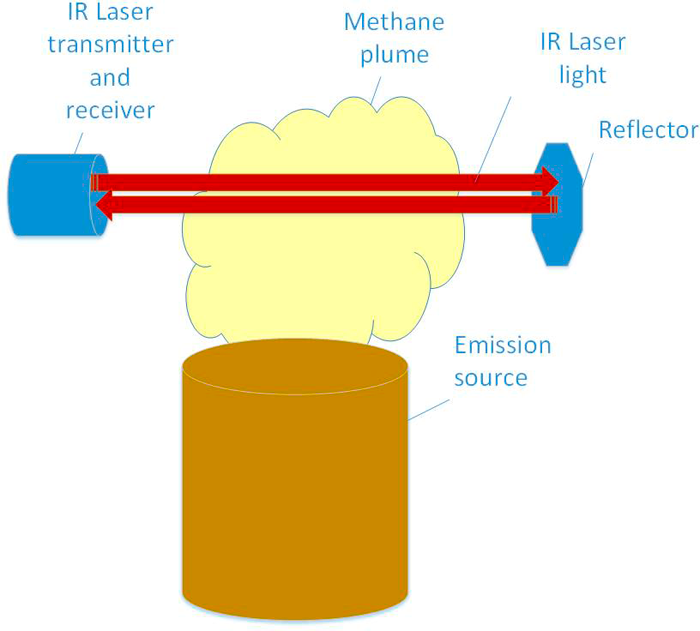
Figure 24. In a monostatic configuration, the transmitter and receiver are co-located. The laser is reflected off a reflector back to the receiver.
Source: Heath Consulting.
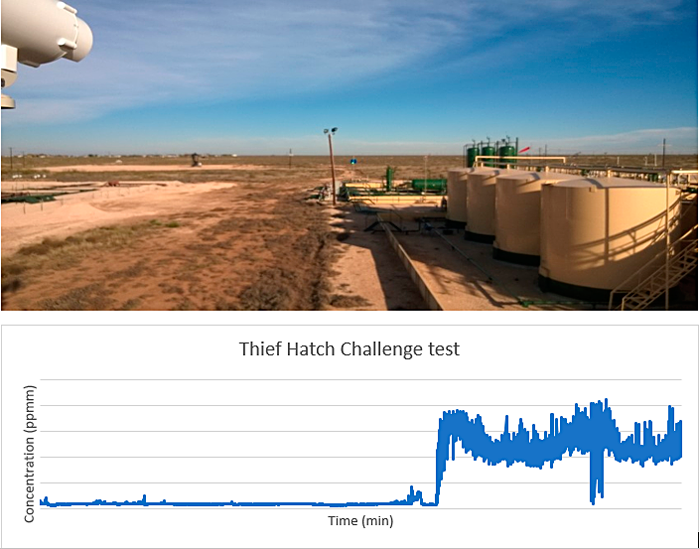
Figure 25. Open path laser adjacent to an oil tank battery. Controlled release shown and detected.
Source: RMLD-REM, supplied by Heath Consultants.
Backscatter. Backscatter is a special case of monostatic. The primary difference is that the natural background is used to reflect back the laser light. Backgrounds could be the ground, foliage, metal structure, etc. Natural backgrounds are not efficient reflectors because most of the light is scattered in all directions. Only a portion of the light is directed back to the receiver. As a result, the scanning distance is often much shorter than when using efficient reflectors.
Portable handheld instruments are based on the backscatter method. The advantage is the ability to scan an area or components rapidly.
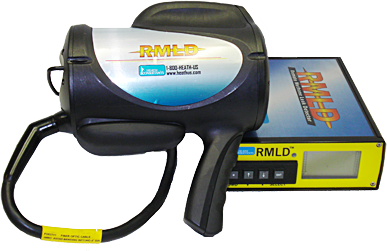
Figure 26. Portable handheld laser used for methane leak surveys and detections.
Source: RMLD-REM, supplied by Heath Consultants.
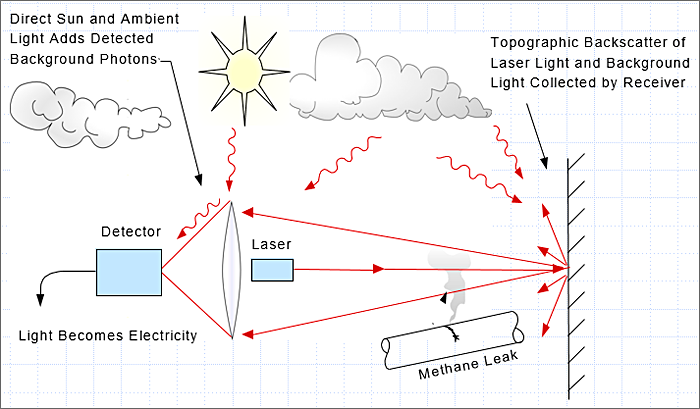
Figure 27. Backscattering.
Source: Heath Consulting.
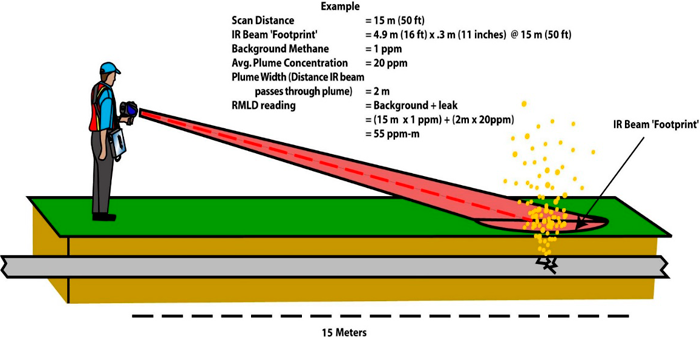
Figure 28. Illustration of laser backscattering and leak detection using a scanning laser.
Source: Heath Consulting.
Range Resolved Differential Absorption Light Detection and Ranging (DIAL). In this configuration, powerful lasers are used to provide a gradient concentration over the path length. The gradient is measured by reflecting two laser wavelengths off of aerosols and particles in the ambient air along its measurement path. The absorption wavelength is keyed to the compound of interest, while the off-absorption feature wavelength is used to measure the decay in strength of the absorption laser signal over a distance. The range is resolved by a function of time. The measurement path is usually rotated in order to provide a complete map of the plume.
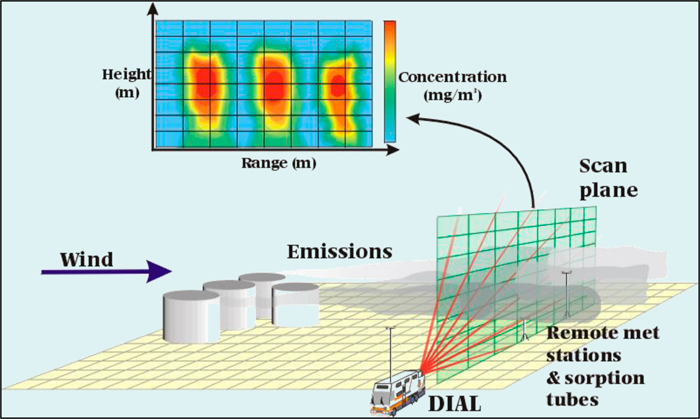
Figure 29. The Differential Absorption Light Detection and Ranging (DIAL) Concept.
Source: USEPA.
4.2.2.12 Etalon ▼Read more
The optical system is composed of a high intensity light source that is typically broad in spectrum, optical band pass filters to reduce the light energy to the specific band of interest (3.3um for methane), polarizers, and photo detector. In order to alternate the birefringence pattern between the “on” and “off” gas spectrum, a means to modulate the light is necessary. The modulation of the light spectrum significantly increases the sensitivity and rejection of interference gases.

Figure 30. Example of Etalon-based instruments used for methane leak detection.
Source: Heath Consulting.
Characteristics: Etalon
- Primary Data Type: quantitative
- Result Type: quantitative (concentration)
- Detection Range (low to high): 100 ppb – 10,000 ppm
- Specificity to Methane/ Interference: specific/low
- Other Benefits: highly reliable and durable
- Measurement Temporal Resolution: milliseconds
- Size: handheld, large
- Typical Deployment Method: walking, vehicle path, fixed
- Environmental Limitations: none
- Calibration Procedure: built in calibration cell typical
- Maturity: mature
- Miscellaneous: widely used for gas distribution surveys
Mode of Use:
In an open path configuration, the light transmitter and receiver are positioned in a direct path open to the atmosphere. In a mobile application, the vehicle will drive through the gas plume causing the optical path to intersect the plume, giving a detection. In portable models, a probe is moved along the ground or along components drawing in a gas sample. As the gas passes through the sample cell, a gas detection results.
4.2.2.13 Optical Gas Imaging (OGI) ▼Read more
Characteristics: Optical Gas Imaging
- Primary Data Type: qualitative
- Result Type: image
- Detection Range (low to high): 0.8 grams/hour (lab demonstrated); Minimal Detectable Leak (MDL) may be poorer under actual field conditions
- Specificity to Methane/ Interference: nonspecific/high
- Other Benefits: allows visualization of plume
- Measurement Temporal Resolution: 30 milliseconds
- Size: handheld
- Typical Deployment Method: walking, vehicle path, fixed
- Environmental Limitations: precipitation interferes; solar flux; gas temperature differential
- Calibration Procedure: no calibration necessary but daily confirmation required with predefined release of gas
- Maturity: mature
- Miscellaneous: results improve with operator training and experience
Mode of Use:
There are two types of optical gas imaging cameras: Passive IR imaging and Active IR imaging. Passive IR imaging cameras use available ambient IR radiation to detect intensity differences between the ambient background IR radiation and the gas plume radiation. Active IR imaging uses an IR light source (i.e., an infrared laser) that is projected toward the area of interest, reflected off a background and is absorbed or attenuated as it encounters a gas species along the optical path. The reflected attenuated infrared light signal is then captured by an infrared detector.
Passive Mid-Wave IR Imaging. For methane gas detection using OGI cameras, the most commonly used infrared detector is a cooled Indium antimonide (InSB) mid-wave detector that operates in the 3-5 µm range and is integrated with a 3.2 – 3.4 µm bandpass spectral filter, specially designed for imaging methane and other hydrocarbon gases. It should be noted that OGI imaging cameras designed for wavelengths within this range may also detect other hydrocarbon gases as they exhibit absorption peaks within this range. OGI cameras are generally recognized not to have the capability to differentiate between various species of detectable hydrocarbon gases. It should be noted that there are variations of mid-wave IR OGI cameras that are designed for the detection of other specific gases such as carbon monoxide (4.52 – 4.67 µm) and carbon dioxide (4.2 – 4.4 µm). Additionally, OGI cameras can have various configurations that include handheld cameras, portable cameras using a mobile stand, and fixed installed cameras within a facility.
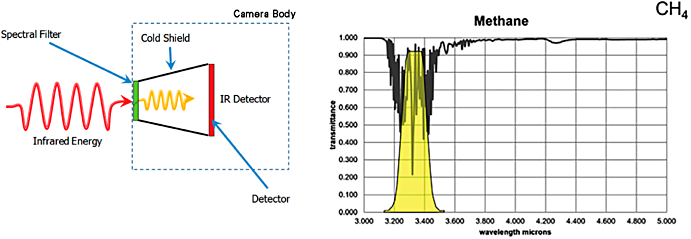
Figure 31. Internal design of an optical gas imaging core and infrared absorption characteristics for methane.
Source: Heath Consulting.
Mid-wave optical gas imagers detect methane and other hydrocarbons due to the molecules of these gases and how they absorb IR radiation. When an OGI camera is pointed at a scene without a gas leak, all objects viewed will emit energy and reflect IR radiation through the lens and filter into the camera. The spectral filter will only allow certain wavelengths of radiation through to the detector to create an image. When a gas cloud exists between the objects being viewed and the camera, and it absorbs radiation in the filter’s band pass, the amount of radiation passing through the cloud will be reduced if the amount of radiation leaving the cloud is not the same as the amount of radiation entering it.

Figure 32. Effect of a gas cloud absorbing radiation.
Source: FLIR Systems.
Mode of Use:
Optical gas imaging technology has been recognized, validated, and approved for use in meeting regulatory compliance reporting requirements by the USEPA, BLM, and certain states. Additionally, the oil and gas (O&G) industry has found expanded use for optical gas imaging camera technology in applications related to leak troubleshooting, preventative maintenance, taking various voluntary measures, and being a cost-effective solution providing savings to industry users. These applications for OGI technology along the O&G value chain are expansive starting with upstream operations (e.g., well-sites, compressor stations, gas plants), mid-stream (e.g., gathering/distribution, energy), and downstream (e.g., refining, petrochemical).
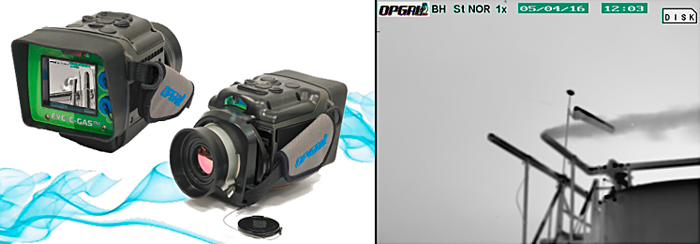
Figure 33. OGI Camera and image of a leak through a relief valve.
Source: OPGAL EyeCGas, supplied by Heath Consultants.
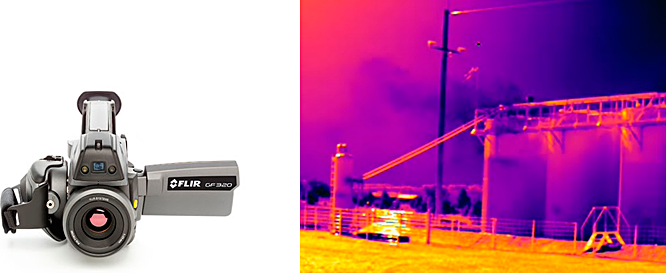
Figure 34. Optical gas imaging camera and image of a leak.
Source: FLIR Systems.
Quantitative Mid-Wave IR Imaging. Quantitative Optical Gas Imaging (QOGI) is a technology in the methane detection market that is a complimentary or add-on device for select mid-wave OGI cameras. QOGI consists of a tablet that connects to specific mid-wave OGI cameras via Universal Serial Bus (USB) and processes the data while connected to the OGI camera. These products allow the user to quantify leak rates in pounds per hour or liters per minute and quantify gases specific to the response factor of the gas. Methane is one of the 400 compounds that have been researched and can be quantified by a QOGI system.
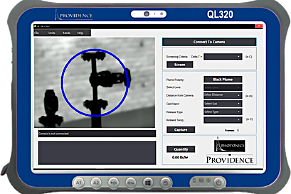
Figure 35. A quantitative OGI system.
Source: Providence Photonics
Passive Long-Wave IR Imaging. Methane also absorbs radiation in the longwave spectra from 7.3 – 8.2 µm. Many thermal imaging or IR cameras are longwave cameras but are not capable of detecting methane and therefore cannot be used for OGI methane leak detection. Longwave cameras with filtering specific to methane’s absorption spectrum would be able to detect methane. These cameras are currently not an approved regulator tool as compared to mid-wave OGI, which has been approved in some instances including the Alternative Work Practice (AWP) for Method 21 and as the best system of emissions reduction (BSER) for 40 CFR Part 60, Subpart OOOOa.
4.2.2.14 Fourier Transform Infrared (FTIR) Spectroscopy ▼Read more
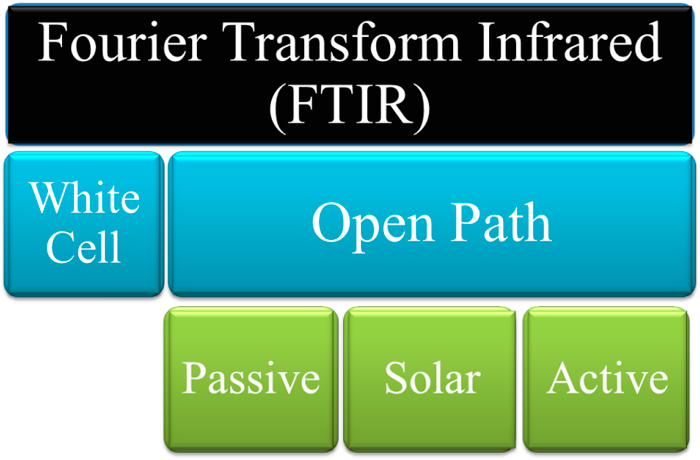
Figure 36. Implementation methods commonly used for FTIR types.
Source: ITRC Methane Team.
The basic principle of measurement uses an infrared radiation beam (generally 2.5 um to 15um wavelength) to interact with gas species that produce unique spectra patterns. The amount of the absorption can be correlated to the concentration and the path length of the interaction of the beam and the sample gas. The infrared beam is produced by an interferometer, which contains a beam-splitter, laser, IR source, and a set of moving and fixed mirrors. The purpose of the interferometer is to allow the measurement of all wavelengths at the same time. The fourier transform (mathematical algorithm) allows the interferogram signal (time/length domain) to be converted to spectra (wavelength domain). The spectra are then used to identify and quantify the compounds in the sample gas using mathematical algorithms such as classical least squares, Beer-Lambert Law, reference spectra, background spectra temperature, pressure, and path length. The path length, detectors (e.g., peak sensitivity, noise, cooling) and interferometers (spectral resolution) vary greatly depending on the need and target compounds. It should be noted that FTIR is capable of the measurement of most volatile inorganic and organic compounds including isotopes (depending on concentration) and isomers with the exception of diatomic. The sensitivity of the measurements can be impaired due to large spectra interferents such as water and carbon dioxides or compounds with similar spectra fingerprints such as C4+ alkanes.
Characteristics: Fourier Transform Infrared (FTIR) Spectroscopy
- Primary Data Type: quantitative
- Result Type: quantitative (concentration)
- Detection Range (low to high): Few hundred ppm-m to %m
- Specificity to Methane/ Interference: specific/low
- Other Benefits: can also detect multiple hydrocarbons
- Measurement Temporal Resolution: 10 minutes
- Size: large
- Typical Deployment Method: fixed
- Environmental Limitations: precipitation
- Calibration Procedure: calibration and some technologies can be calibration free
- Maturity: mature
- Miscellaneous: N/A
White Cell Description:
In this mode of operation, the FTIR is used in a point monitor configuration. The instrument has the light source, interferometer, white cell, and detector together. The sample gas is either pushed or pulled into the cell continuously or in static batches. The white cell serves as a vessel to maintain the extracted sample gas at a consistent temperature and pressure, which is necessary for the use of reference spectra, and to allow the infrared radiation to be bounced multiple times through the gas in order to increase the path length for more sensitive measurements. White cells can either be a fixed or adjustable path length and are generally temperature controlled.
Open Path. In this mode of operation, the FTIR is used in an open path format, which allows for infrared radiation beams to pass through the sample gas in the environment without need for sample extraction or conditioning. The Open Path FTIR instruments have several configurations such as passive, solar, monostatic, and bi-static, which serve different purposes. Open path measurements generate a path averaged concentration over the path length of the measurement.
Passive (Monostatic). In this mode of operation, the FTIR uses an external elevated temperature source (e.g., a flame or combustion vent) to provide the infrared radiation. The elevated temperature gas compounds emit an infrared signature specific to their compound structure and temperature. This infrared radiation is then collected by the FTIR and analyzed. This technique must also account for the stray solar radiation and the compounds in the air between the elevated temperature source and the detector. The results from this technique are usually provided in a ratio of concentrations as the width of the plume is generally dynamic during measurements.
Mode of Use:
Very similar to the mode of operation as CRDS.
Solar (Monostatic). Similar to the passive, the solar FTIR uses an external infrared source (i.e., the sun) for the infrared radiation. The use of the sun as a source provides information on the total air column between the FTIR and the sun. Compounds at the ground level must be determined by the spectral shape changes due to temperature and pressure within the atmosphere. There are also techniques which use the Solar FTIR (Solar Occultation Flux) in a mobile format, which can provide a background level of compounds in the total air column to understand the local contribution of a source or sources.
4.2.2.15 Gas Filter Correlation Radiometry (GFCR) ▼Read more

Figure 37. Gas Filter Correlation Radiometry (GFCR) general operation concept.
Source: Bluefield.
Characteristics: Gas Filter Correlation Radiometer (GFCR)
- Primary Data Type: quantitative
- Result Type: quantitative (concentration)
- Detection Range (low to high): TBD – (satellite target is 15 kg/hr to 150 k/hr for 20 m2 to 1 km2 resolution, depending upon satellite design)
- Specificity to Methane/ Interference: specific/ moderate
- Other Benefits: allows visualization of plume
- Measurement Temporal Resolution: 10 seconds
- Size: large
- Typical Deployment Method: vehicle path
- Environmental Limitations: clouds, precipitation, requires sun
- Calibration Procedure: calibration gas (ground-based instrument)
- Maturity: developing
- Miscellaneous: N/A
Mode of Use:
GFCR is well-suited for trace gas measurement implementation on airplane/drones and microsatellites, as classical spectrometer technologies cannot reach the required size to be operated without substantial loss of performance, swath, or spatial resolution. Vendors are currently working to deploy GFCR sensors on microsatellites for the detection of methane emissions and ground leaks from space, which combined with image processing artificial intelligence, will provide accurate global coverage of every emitter on Earth with a very high frequency of measurements (i.e., monthly or daily, depending on the number of microsatellites).
Publication Date: September 28, 2018


